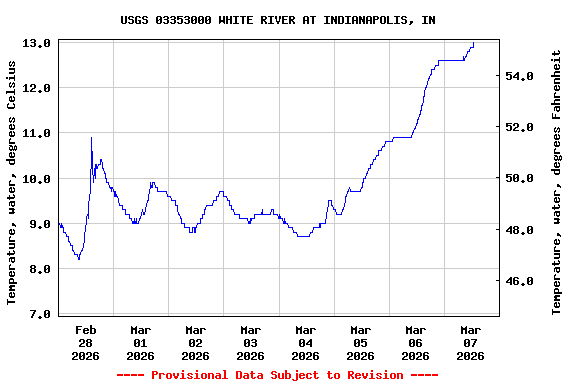
Most recent instantaneous value: 12.9 03-07-2026 11:45 EST
See this graph on the Monitoring Location Pages
Click here to view flood inundation maps for this gaging station.
This gaging station is maintained in cooperation with:
| Boating safety tips |
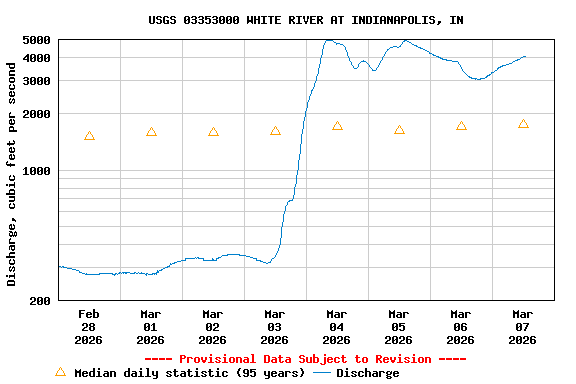
| Min (1935) | 25th percen- tile | Median | Mean | 75th percen- tile | Most Recent Instantaneous Value Mar 7 | Max (1963) |
|---|---|---|---|---|---|---|
| 215 | 1090 | 1750 | 3010 | 3510 | 4000 | 23800 |
![]() U.S. Department of the Interior |
U.S. Geological Survey
U.S. Department of the Interior |
U.S. Geological Survey
Title: USGS Current Conditions for Indiana
URL:
Page Contact Information: Indiana Water Data Support Team
Page Last Modified: 2026-03-07 12:08:27 EST
4.41 3.49 sdww02