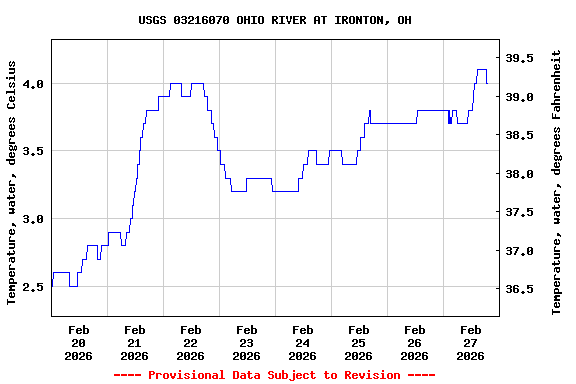
Most recent instantaneous value: 4.1 02-27-2026 18:00 EST
See this graph on the Monitoring Location Pages
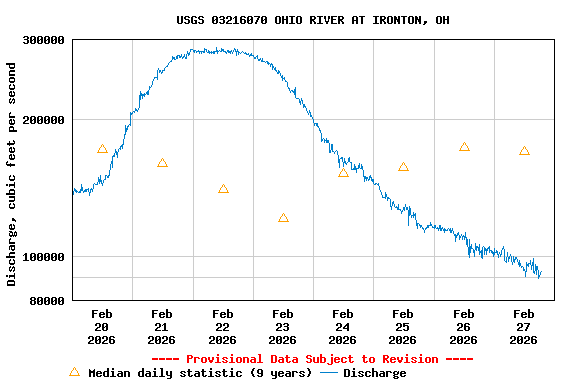
| Min (2017) | Most Recent Instantaneous Value Feb 27 | 25th percen- tile | Median | Mean | 75th percen- tile | Max (2022) |
|---|---|---|---|---|---|---|
| 83900 | 90900 | 100000 | 170000 | 215000 | 354000 | 381000 |
Chlorophyll relative fluorescence (fChl), water, in situ, relative fluorescence units (RFU) |
||
|
||
Chlorophyll fluorescence (fChl), water, in situ, concentration estimated from reference material, micrograms per liter as chlorophyll |
||
|
||
Phycocyanin fluorescence (fPC), water, in situ, concentration estimated from reference material, micrograms per liter as phycocyanin |
||
|
||
Phycocyanin relative fluorescence (fPC), water, in situ, relative fluorescence units (RFU) |
||
|
||
![]() U.S. Department of the Interior |
U.S. Geological Survey
U.S. Department of the Interior |
U.S. Geological Survey
Title: USGS Current Conditions for Kentucky
URL:
Page Contact Information: Kentucky Water Data Support Team
Page Last Modified: 2026-02-27 18:41:43 EST
5.75 3.94 vaww01