PROVISIONAL DATA SUBJECT TO REVISION
Click to hidestation-specific text
This site is operated in cooperation with the

United States Army Corps of Engineers - Louisville District

Louisville Water Company

Metropolitan Sewer District
Gage Datums:
407.18 ft (1929 NGVD)
406.88 ft (1988 NAVD)
Boating safety tips
United States Army Corps of Engineers - Louisville District
Louisville Water Company
Metropolitan Sewer District
Gage Datums:
407.18 ft (1929 NGVD)
406.88 ft (1988 NAVD)
Boating safety tips
Summary of all available data for this site
Instantaneous-data availability statement

![Graph of Gage height, feet, [(2)]](https://natwebsdww02.cr.usgs.gov/nwisweb/data/img/USGS.03292494.60090.00065..20260311.20260318..0..gif)
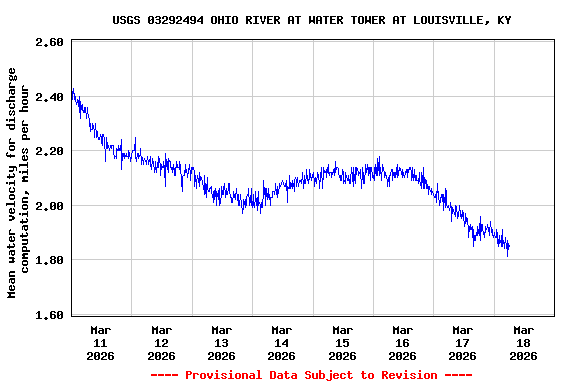
![Graph of Mean water velocity for discharge computation, feet per second, [X velocity]](https://natwebsdww02.cr.usgs.gov/nwisweb/data/img/USGS.03292494.166863.72255..20260311.20260318..0..gif)