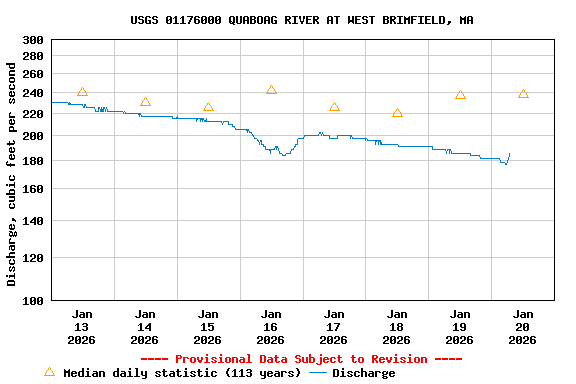
Page Loading - Please Wait...
ICE EFFECTS ON STREAMFLOW
The formation of ice on rivers can cause discharge values to appear unusually high. Display of these erroneous discharge data may result in improper assessment of flow conditions and misuse of the data. For this reason, display of discharge values for streams significantly affected by ice may be disabled from view. Display of discharge data will resume when ice conditions are no longer present. Discharge values for streams minimally affected by ice will continue to be displayed. Flows for streams with these conditions appear to increase during the night and decrease to near-base-line conditions around midday. To estimate the correct discharge for these streams, use the flow rate that corresponds to the bottom of the discharge curve, rather than the peak that corresponds to the top of the curve. Note that this method of estimation is possible only when no surface runoff is occurring. Daily mean discharges for periods of both significant and minimal ice-effect will be estimated and published in the Annual Water-Data Report for the water year in which they occurred.
LOCATION--Lat 42° 10'56", long 72° 15'51",
Hampden County, Hydrologic Unit 01080204, on right bank 10 ft upstream
from abandoned highway bridge site at West Brimfield, 0.9 mi upstream
from Blodgett Mill Brook, 3.5 mi northeast of Palmer, and 9.9 mi
upstream from mouth.
DRAINAGE AREA--150 mi2.
PERIOD OF RECORD--Discharge: August 1909 to July 1912
(twice-daily gage heights and corresponding discharges), August 1912 to
current year.
Water-quality records: Water years 1953, 1967, 1969–70,
1972–74.
REVISED RECORDS--WSP 451: 1916. WSP 1301: 1918(M). WDR
MA-RI-84-1: drainage area.
GAGE--Data Collection Platform with satellite telemeter. Datum
of gage is 389.36 ft above NAVD 1988, estimated from topographic map.
Prior to May 11, 2020, datum reported as 390 ft above NGVD 1929,
estimated from topographic map. Prior to Aug. 19, 1912, nonrecording
gage, and Aug. 19, 1912, to Oct. 31, 1955, water-stage recorder, at
several sites 0.5 mi downstream at different datum.
REMARKS--Slight diurnal fluctuation at low flow caused by mill
upstream prior to 1956; regulation much greater prior to 1938. High
flow slightly affected by retarding reservoirs since 1965.
COOPERATION BY--Massachusetts Department
of Conservation and Recreation, Office of Water
Resources.
Boating safety tips |
Min (1931) | Most Recent Instantaneous Value Mar 8 | 25th percen- tile | Median | Mean | 75th percen- tile | Max (2011) |
---|---|---|---|---|---|---|
86.0 | 238 | 244 | 350 | 422 | 509 | 1810 |