NOTICE (10/01/2023)--Water quality
data collection at this streamgage has been discontinued. If there are
questions concerning the operation of this site, please contact Chuck
Walker (cwwalker@usgs.gov;443-498-5523).
 LOCATION.
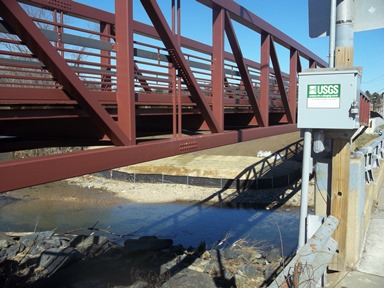
--Lat 39°19'04.7", long
76°33'18.5", Baltimore City, MD, Hydrologic Unit 02060003, on
right upstream side of bridge on Sinclair Lane, and 4.4 mi upstream
from mouth.
DRAINAGE AREA.--16.3 mi
2, from automated delineation
using 30-meter National Elevation Dataset, digital elevation model
data, dated 2011.
PERIOD OF RECORD.--October 2013 to current year.
PERIOD OF WATER QUALITY RECORD.--October 2015 to current
year.
REVISIONS HISTORY.--
https://waterdata.usgs.gov/nwis/dv/?site_no=01585219:
2019: Discharge.
https://waterdata.usgs.gov/nwis/dv/?site_no=01585219:
2021: Water Temperature.
https://waterdata.usgs.gov/nwis/dv/?site_no=01585219:
2021: Turbidity.
GAGE.--Water-stage recorder and crest-stage gage. Datum of gage
is 31.25 ft above North American Vertical Datum of 1988.
REMARKS.--U.S. Geological Survey satellite data-collection
platform at station.
EXTREMEMES FOR PERIOD OF RECORD.--Maximum discharge, 7,930
ft³/s, Feb. 24, 2016, gage height, 14.68 ft; minimum discharge, 1.0
ft³/s, Sept. 25, 2020, result of regulation from unknown source,
upstream from station.
COOPERATION.--Funding for the operation of this station is
provided by the Baltimore City Department of Public Works, and the U.S.
Geological Survey.

