 LOCATION.
--Lat 39°24'10.2", long
77°21'57.9", Frederick County, MD, Hydrologic Unit 02070009,
on right bank 500 ft downstream from Interstate 70 highway bridge, 0.4
mi downstream from Linganore Creek, 2.0 mi east of Frederick, and 16.9
mi upstream from mouth.
DRAINAGE AREA.--817 mi
2.
PERIOD OF RECORD.--October 1929 to current year. Monthly
discharge only for October, November 1929, published in WSP 1302.
REVISED RECORDS.--WSP 711: 1930.
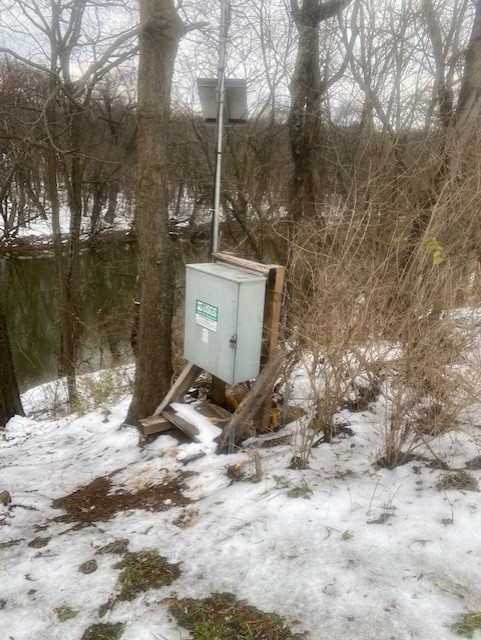
GAGE.--Water-stage recorder and crest-stage gage. Nonrecording
gage at site 0.2 mile downstream. Datum of gage is 231.21 ft above
North American Vertical Datum of 1988.
REMARKS.--Occasional regulation at low and medium flows since
September 1972 by Linganore Reservoir, total capacity, 883,200,000 gal,
2.8 mi upstream from station. U.S. Geological Survey satellite
data-collection platform at station. Water-quality records for some
prior periods have been collected at this location.
EXTREMES FOR PERIOD OF RECORD.--Maximum discharge, 81,600
ft
3/s, June 23, 1972, gage height, 35.90 ft; minimum
discharge, 17 ft
3/s, Sept. 11, 13, 1966.
EXTREMES OUTSIDE PERIOD OF RECORD.--Flood in June 1889 reached a
stage of 30 ft, from floodmarks, discharge, 56,000
ft
3/s.
COOPERATION.--Funding for the operation of this station is
provided by the Maryland Department of Transportation, and the U.S.
Geological Survey.

