USGS 01412350 Delaware Bay at Ship John Shoal Lighthouse NJ

PROVISIONAL DATA SUBJECT TO REVISION

Click to hidestation-specific text
Click for larger image 
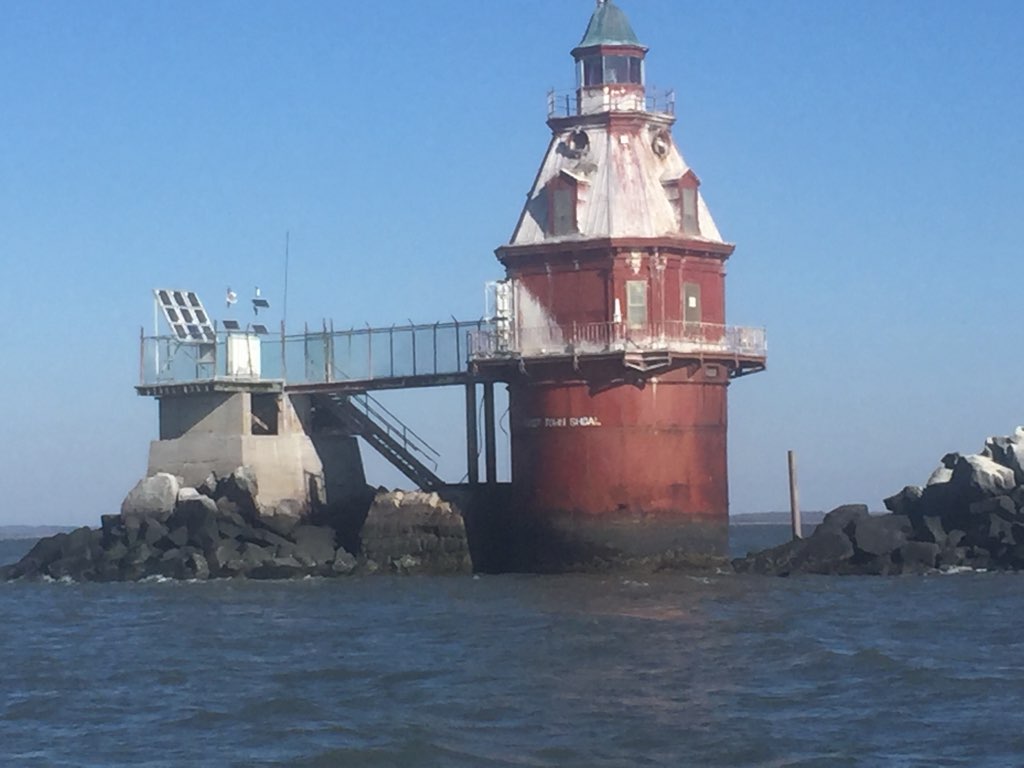
LOCATION.--Lat 39°18'19.5", long 75°22'35.6", referenced to North American Datum of 1983, Cumberland County, NJ, Hydrologic Unit 02040204, at Ship John Shoal Lighthouse.
DRAINAGE AREA.--Not determined.
PERIOD OF RECORD.-- April 1969 to July 1986. March 2021 to current year.
GAGE.--Electronic data logger and two water-quality monitors.
REMARKS.--U.S. Geological Survey satellite data-collection platform at station.
COOPERATION.--Funding for this station is provided by the Next Generation Water Observing Systems Delaware River Basin Project.


NOTICE: The upper water-quality sensor at this site is exposed to air during low tides. Erroneous values are deleted using an automated screening process.

This station managed by the MD-DE-DC Water Science Center Dover office.

Available Parameters Available Period
  
2021-03-10  2024-04-19
2021-03-10  2024-04-19
2021-03-10  2024-04-19
2021-03-10  2024-04-19
2021-03-10  2024-04-19
2021-03-10  2024-04-19


 (7)
 

  -- or --


Summary of all available data for this site
Instantaneous-data availability statement


Temperature, water, degrees Celsius, Lower

Most recent instantaneous value: 13.4 04-19-2024   05:30 EDT
Graph of

Add up to 2 more sites and replot for "Temperature, water, degrees Celsius, Lower"

?


Create presentation-quality / stand-alone graph.   Subscribe to WaterAlert      

See this graph on the Monitoring Location Pages


Temperature, water, degrees Celsius, Upper

Most recent instantaneous value: 13.4 04-19-2024   05:30 EDT
Graph of

Add up to 2 more sites and replot for "Temperature, water, degrees Celsius, Upper"

?


Create presentation-quality / stand-alone graph.   Subscribe to WaterAlert      

See this graph on the Monitoring Location Pages


Specific conductance, water, unfiltered, microsiemens per centimeter at 25 degrees Celsius, Lower

Most recent instantaneous value: 10700 04-19-2024   05:30 EDT
Graph of

Add up to 2 more sites and replot for "Specific conductance, water, unfiltered, microsiemens per centimeter at 25 degrees Celsius, Lower"

?


Create presentation-quality / stand-alone graph.   Subscribe to WaterAlert      

See this graph on the Monitoring Location Pages


Specific conductance, water, unfiltered, microsiemens per centimeter at 25 degrees Celsius, Upper

Most recent instantaneous value: 10600 04-19-2024   05:30 EDT
Graph of

Add up to 2 more sites and replot for "Specific conductance, water, unfiltered, microsiemens per centimeter at 25 degrees Celsius, Upper"

?


Create presentation-quality / stand-alone graph.   Subscribe to WaterAlert      

See this graph on the Monitoring Location Pages


Dissolved oxygen, water, unfiltered, milligrams per liter, Lower

Most recent instantaneous value: 9.5 04-19-2024   05:30 EDT
Graph of

Add up to 2 more sites and replot for "Dissolved oxygen, water, unfiltered, milligrams per liter, Lower"

?


Create presentation-quality / stand-alone graph.   Subscribe to WaterAlert      

See this graph on the Monitoring Location Pages


Dissolved oxygen, water, unfiltered, milligrams per liter, Upper

Most recent instantaneous value: 9.7 04-19-2024   05:30 EDT
Graph of

Add up to 2 more sites and replot for "Dissolved oxygen, water, unfiltered, milligrams per liter, Upper"

?


Create presentation-quality / stand-alone graph.   Subscribe to WaterAlert      

See this graph on the Monitoring Location Pages