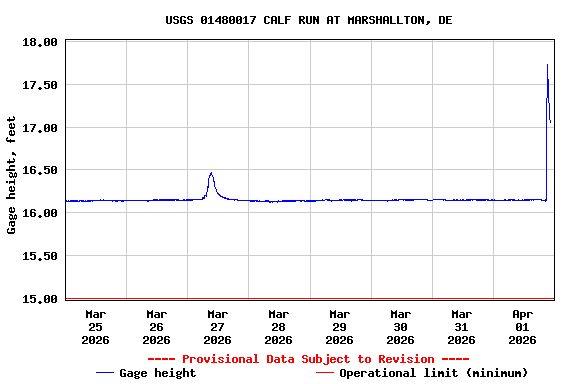
USGS 01480017 CALF RUN AT MARSHALLTON, DE

PROVISIONAL DATA SUBJECT TO REVISION

Click to hidestation-specific text
LOCATION.-- On right bank at upstream side of highway bridge on Robert W. Kirkwood Highway (State Route 2), at Marshallton, and 1.62 mi upstream from mouth.
PERIOD OF RECORD.-- May 2015 to current year. Prior to August 20, 2020, site known as RED CLAY CREEK TRIBUTARY AT MARSHALLTON, DE.
GAGE.-- Water-stage recorder and crest stage gage. Datum of gage is 40.07 ft above North American Vertical Datum of 1988.
This station managed by the MD-DE-DC Water Science Center Dover office.

Available Parameters Available Period
  
2015-05-14  2026-04-01
2015-05-14  2026-04-01
2025-12-02  2026-04-01


 (7)
 

  -- or --


Summary of all available data for this site
Instantaneous-data availability statement


Discharge, cubic feet per second

Most recent instantaneous value: 57.8 04-01-2026   21:15 EDT
Graph of  Discharge, cubic feet per second

Add up to 2 more sites and replot for "Discharge, cubic feet per second"

?


Create presentation-quality / stand-alone graph.   Subscribe to WaterAlert      

See this graph on the Monitoring Location Pages


Daily discharge, cubic feet per second -- statistics for Apr 1 based on 8 water years of record more
Min
(2016)
25th
percen-
tile
Median Mean 75th
percen-
tile
Max
(2023)
Most Recent
Instantaneous
Value Apr 1
0.21 0.26 0.54 0.93 1.7 2.35 57.8


Gage height, feet

Most recent instantaneous value: 17.69 04-01-2026   21:15 EDT
Graph of  Gage height, feet

Add up to 2 more sites and replot for "Gage height, feet"

?


Create presentation-quality / stand-alone graph.   Subscribe to WaterAlert      

See this graph on the Monitoring Location Pages


Stream water level elevation above NAVD 1988, in feet

Most recent instantaneous value: 57.76 04-01-2026   21:15 EDT
Graph of  Stream water level elevation above NAVD 1988, in feet

Add up to 2 more sites and replot for "Stream water level elevation above NAVD 1988, in feet"

?


Create presentation-quality / stand-alone graph.   Subscribe to WaterAlert      

See this graph on the Monitoring Location Pages