PROVISIONAL DATA SUBJECT TO REVISION
Click to hidestation-specific text
 LOCATION.--Lat
39°28'53.2", long 76°20'25.6", Harford County, MD,
Hydrologic Unit 02060003, on right bank, approximately 200 ft
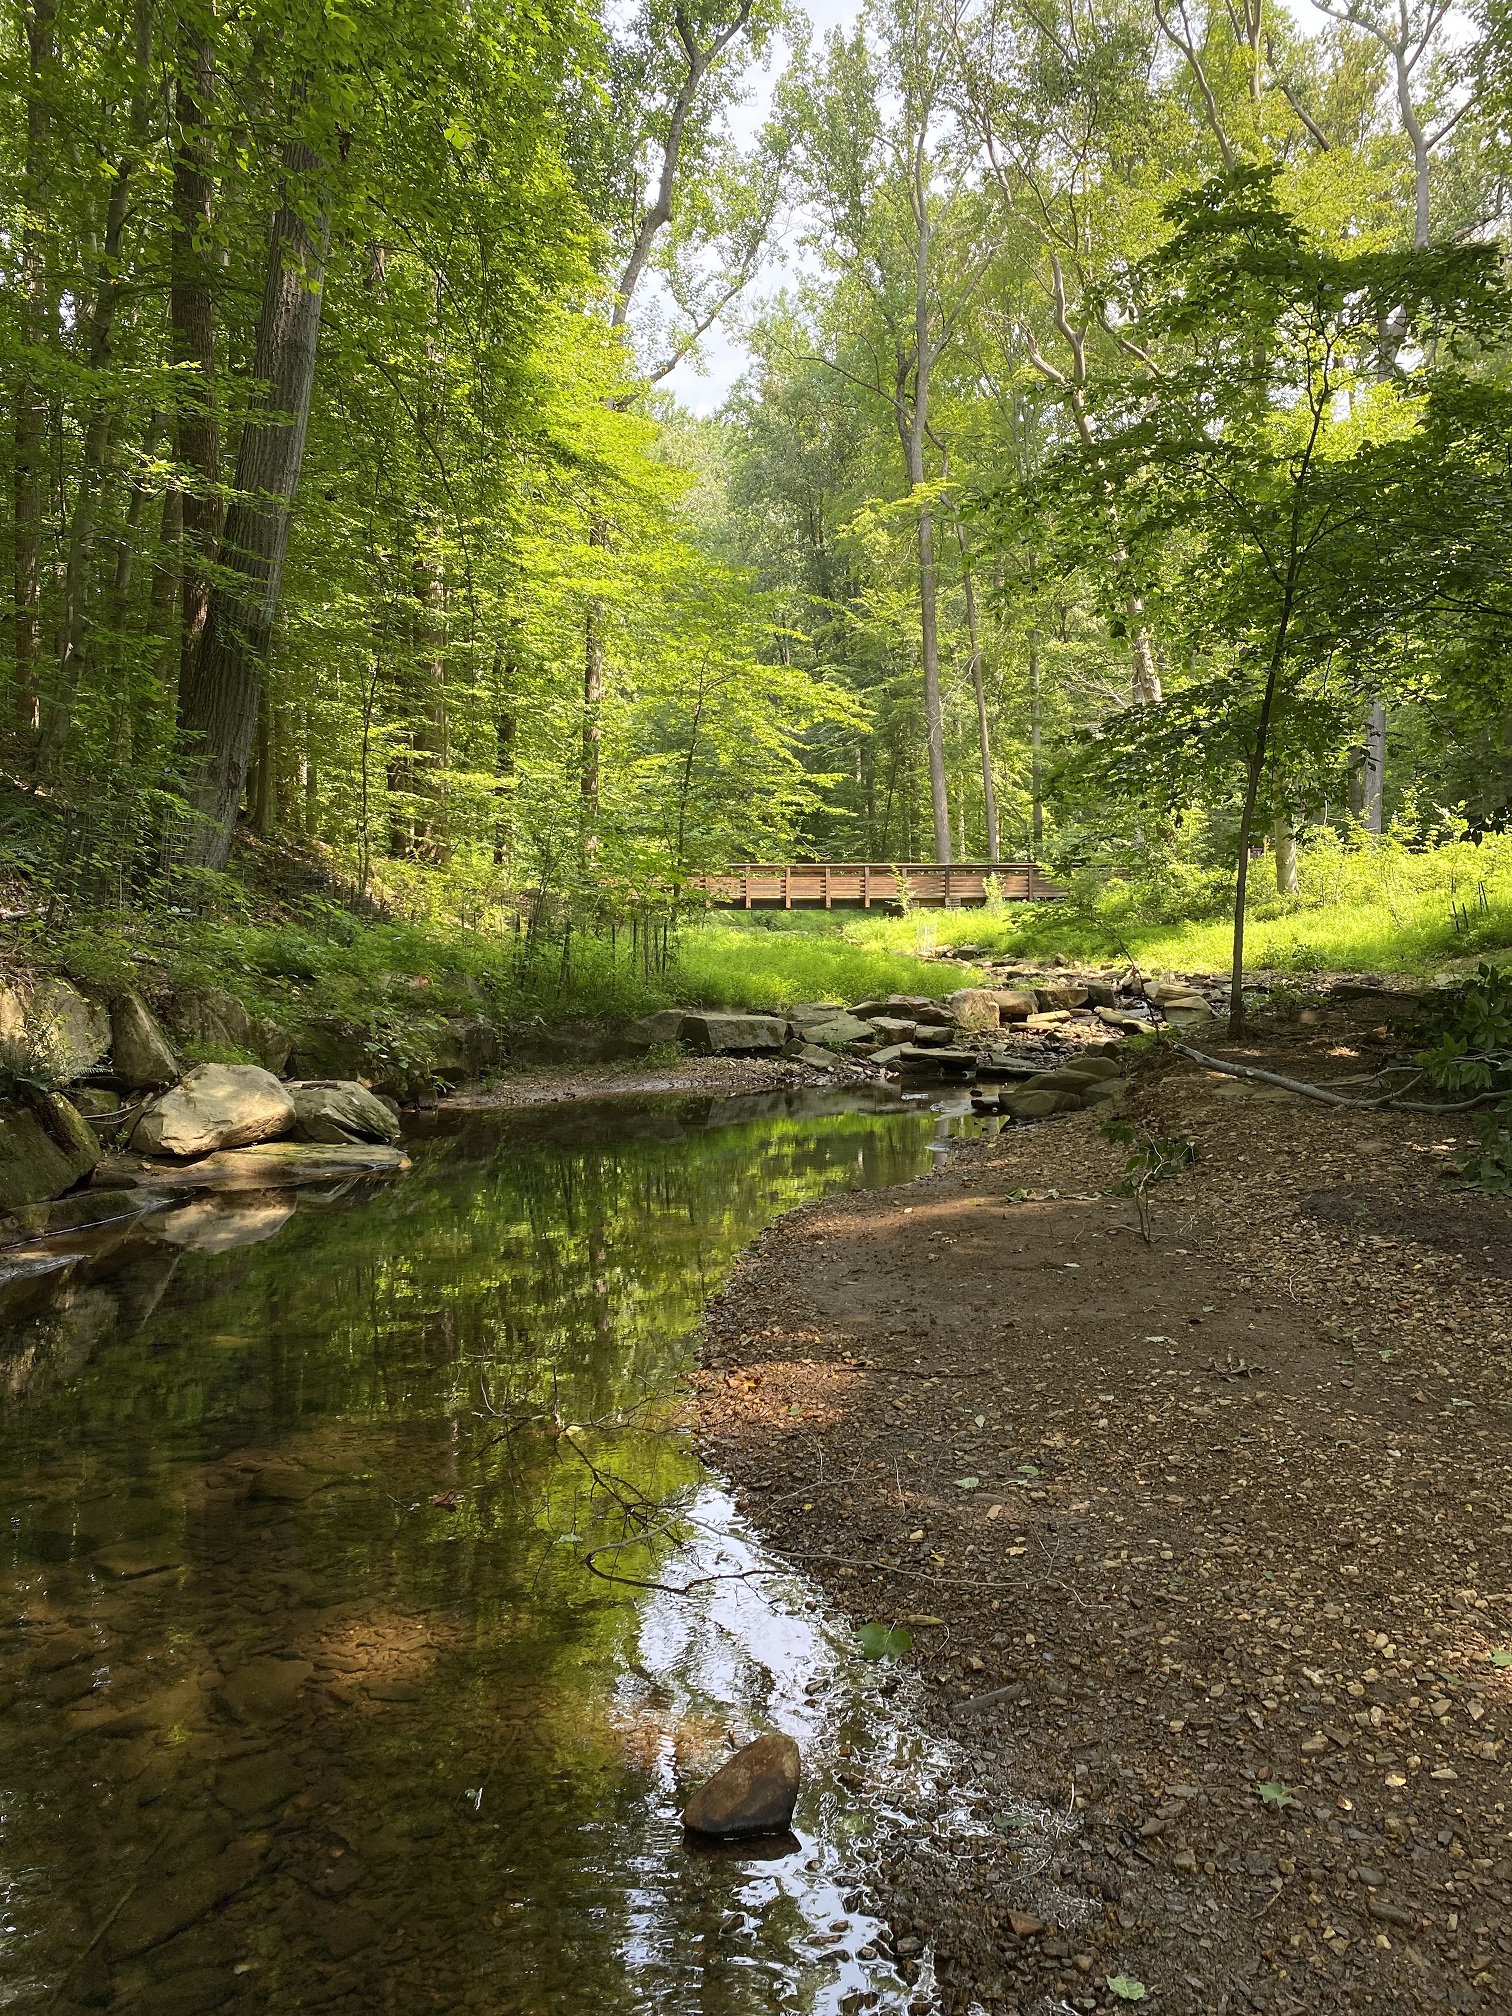
downstream of wooden foot bridge along walking path in Harford Glen
Park, 2.4 mi northwest of Abingdon, 4.3 mi south of Bel Air, and
approximately 300 ft upstream of confluence with Atkisson
Reservoir.
LOCATION.--Lat
39°28'53.2", long 76°20'25.6", Harford County, MD,
Hydrologic Unit 02060003, on right bank, approximately 200 ft
downstream of wooden foot bridge along walking path in Harford Glen
Park, 2.4 mi northwest of Abingdon, 4.3 mi south of Bel Air, and
approximately 300 ft upstream of confluence with Atkisson
Reservoir.DRAINAGE AREA.--0.66 mi2.
PERIOD OF RECORD.--October 2009 to current year.
REVISIONS HISTORY.--https://waterdata.usgs.gov/nwis/uv/?site_no=0158175320: 2019, 2020
GAGE.--Water-stage recorder and crest-stage gage. Datum of gage is 120.63 ft above North American Vertical Datum of 1988. Prior to January 26, 2017, at site 110 ft upstream on right bank at same gage datum. Prior to July 17, 2019, at site 100 ft upstream on left bank at same gage datum.
REMARKS.--U.S. Geological Survey satellite data-collection platform at station.
EXTREMES FOR PERIOD OF RECORD.--Maximum discharge, 596 ft3/s, Aug. 18, 2017, gage height, 6.76 ft; minimum discharge, 0.06 ft3/s, Sept. 4, 5, 8, 9, 2010.
COOPERATION.--Funding for the operation of this station is provided by the Harford County Department of Public Works.
| Boating safety tips |
Summary of all available data for this site
Instantaneous-data availability statement

