PROVISIONAL DATA SUBJECT TO REVISION
Click to hidestation-specific text
|
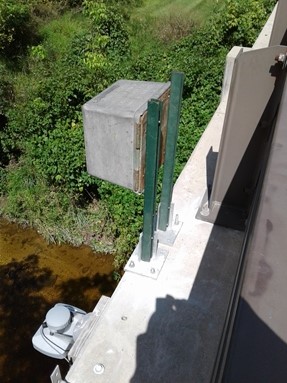 |
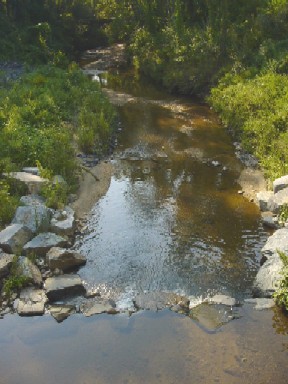
LOCATION.--Lat 39°22'14.8", 1ong 76°26'45.8", Baltimore County, MD, Hydrologic Unit 02060003,
   at upstream side of bridge on State Highway 7, 1.0 mi southwest of White Marsh, and 3.0 mi upstream from mouth.
DRAINAGE AREA.--7.61 mi2.
PERIOD OF RECORD.--February 1959 to September 1989, March 1992 to current year.
REVISIONS HISTORY.--WDR MD-DE-73-1: 1960(M), 1967-68, 1969(M). WDR MD-DE-79-1: 1965-66(M). WRD-US-2010: 2006-07(P).
GAGE.--Water-stage recorder, crest-stage gage, and rock control. Datum of gage is 33.71 ft above North American Vertical Datum of 1988.
   Prior to June 12, 2002, water-stage recorder at site on left bank, upstream side of Route 7 bridge at gage datum 4.44 ft higher.
   June 12, 2002 to September 30, 2004, water-stage recorder at site 2,500 ft upstream, on left downstream side of Interstate 95
   box culvert at gage datum 4.44 ft higher. September 30, 2004 to September 8, 2017, water-stage recorder at site 80 ft downstream
   on right wing wall at present datum.
REMARKS.--U.S. Geological Survey satellite data-collection platform at station. Low flow affected by operations of sand and
   gravel plant in vicinity of gage.
COOPERATION.--Funding for the operation of this station is provided by the Maryland Department of Transportation,
   and the U.S. Geological Survey.
| Boating safety tips |
Summary of all available data for this site
Instantaneous-data availability statement

