PROVISIONAL DATA SUBJECT TO REVISION
Click to hidestation-specific text
|
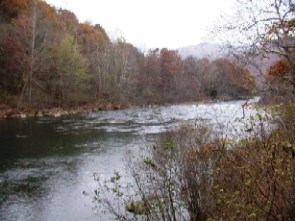 |
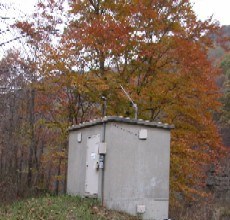
LOCATION.-- Lat 39°26'42.4", long 79°06'38.9", Mineral County, WV, Hydrologic Unit 02070002,
   on right bank at Barnum, W. Va., 1.7 mi below Jennings Randolph Lake, 0.4 mi upstream from Folly Run, and
   4.0 mi southwest of Piedmont, W. Va., at mile 59.4.
DRAINAGE AREA.--266 mi2.
PERIOD OF RECORD.--July 1966 to September 1985, October 1985 to September 2003 (operated as a partial-record station only),
   October 2003 to current year.
REVISIONS HISTORY.--https://waterdata.usgs.gov/nwis/dv/?site_no=01595800: 2018.
GAGE.--Water-stage recorder and crest-stage gage.  Datum of gage is 1,151.28 ft above North American Vertical Datum of 1988.
REMARKS.--Prior to July 1981, regulation of low flow by Stony River Reservoir, 39 mi upstream from station (see station 01595200).
   Since July 1981, complete regulation by Jennings Randolph Lake, 1.7 mi upstream from station, capacity 96,600 acre-ft.
   U.S. Army Corps of Engineers satellite data-collection platform at station.
EXTREMES FOR PERIOD OF RECORD.--Maximum discharge, 27,100 ft3/s, July 3, 1978, gage height, 13.37 ft;
   minimum discharge, 0.91 ft3/s, Aug. 12, 1981.
COOPERATION.--Funding for the operation of this station is provided by the U.S. Army Corps of Engineers,
   and the U.S. Geological Survey.
Summary of all available data for this site
Instantaneous-data availability statement

