PROVISIONAL DATA SUBJECT TO REVISION
Click to hidestation-specific text
 |
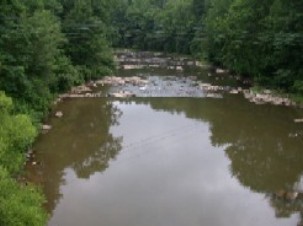 |
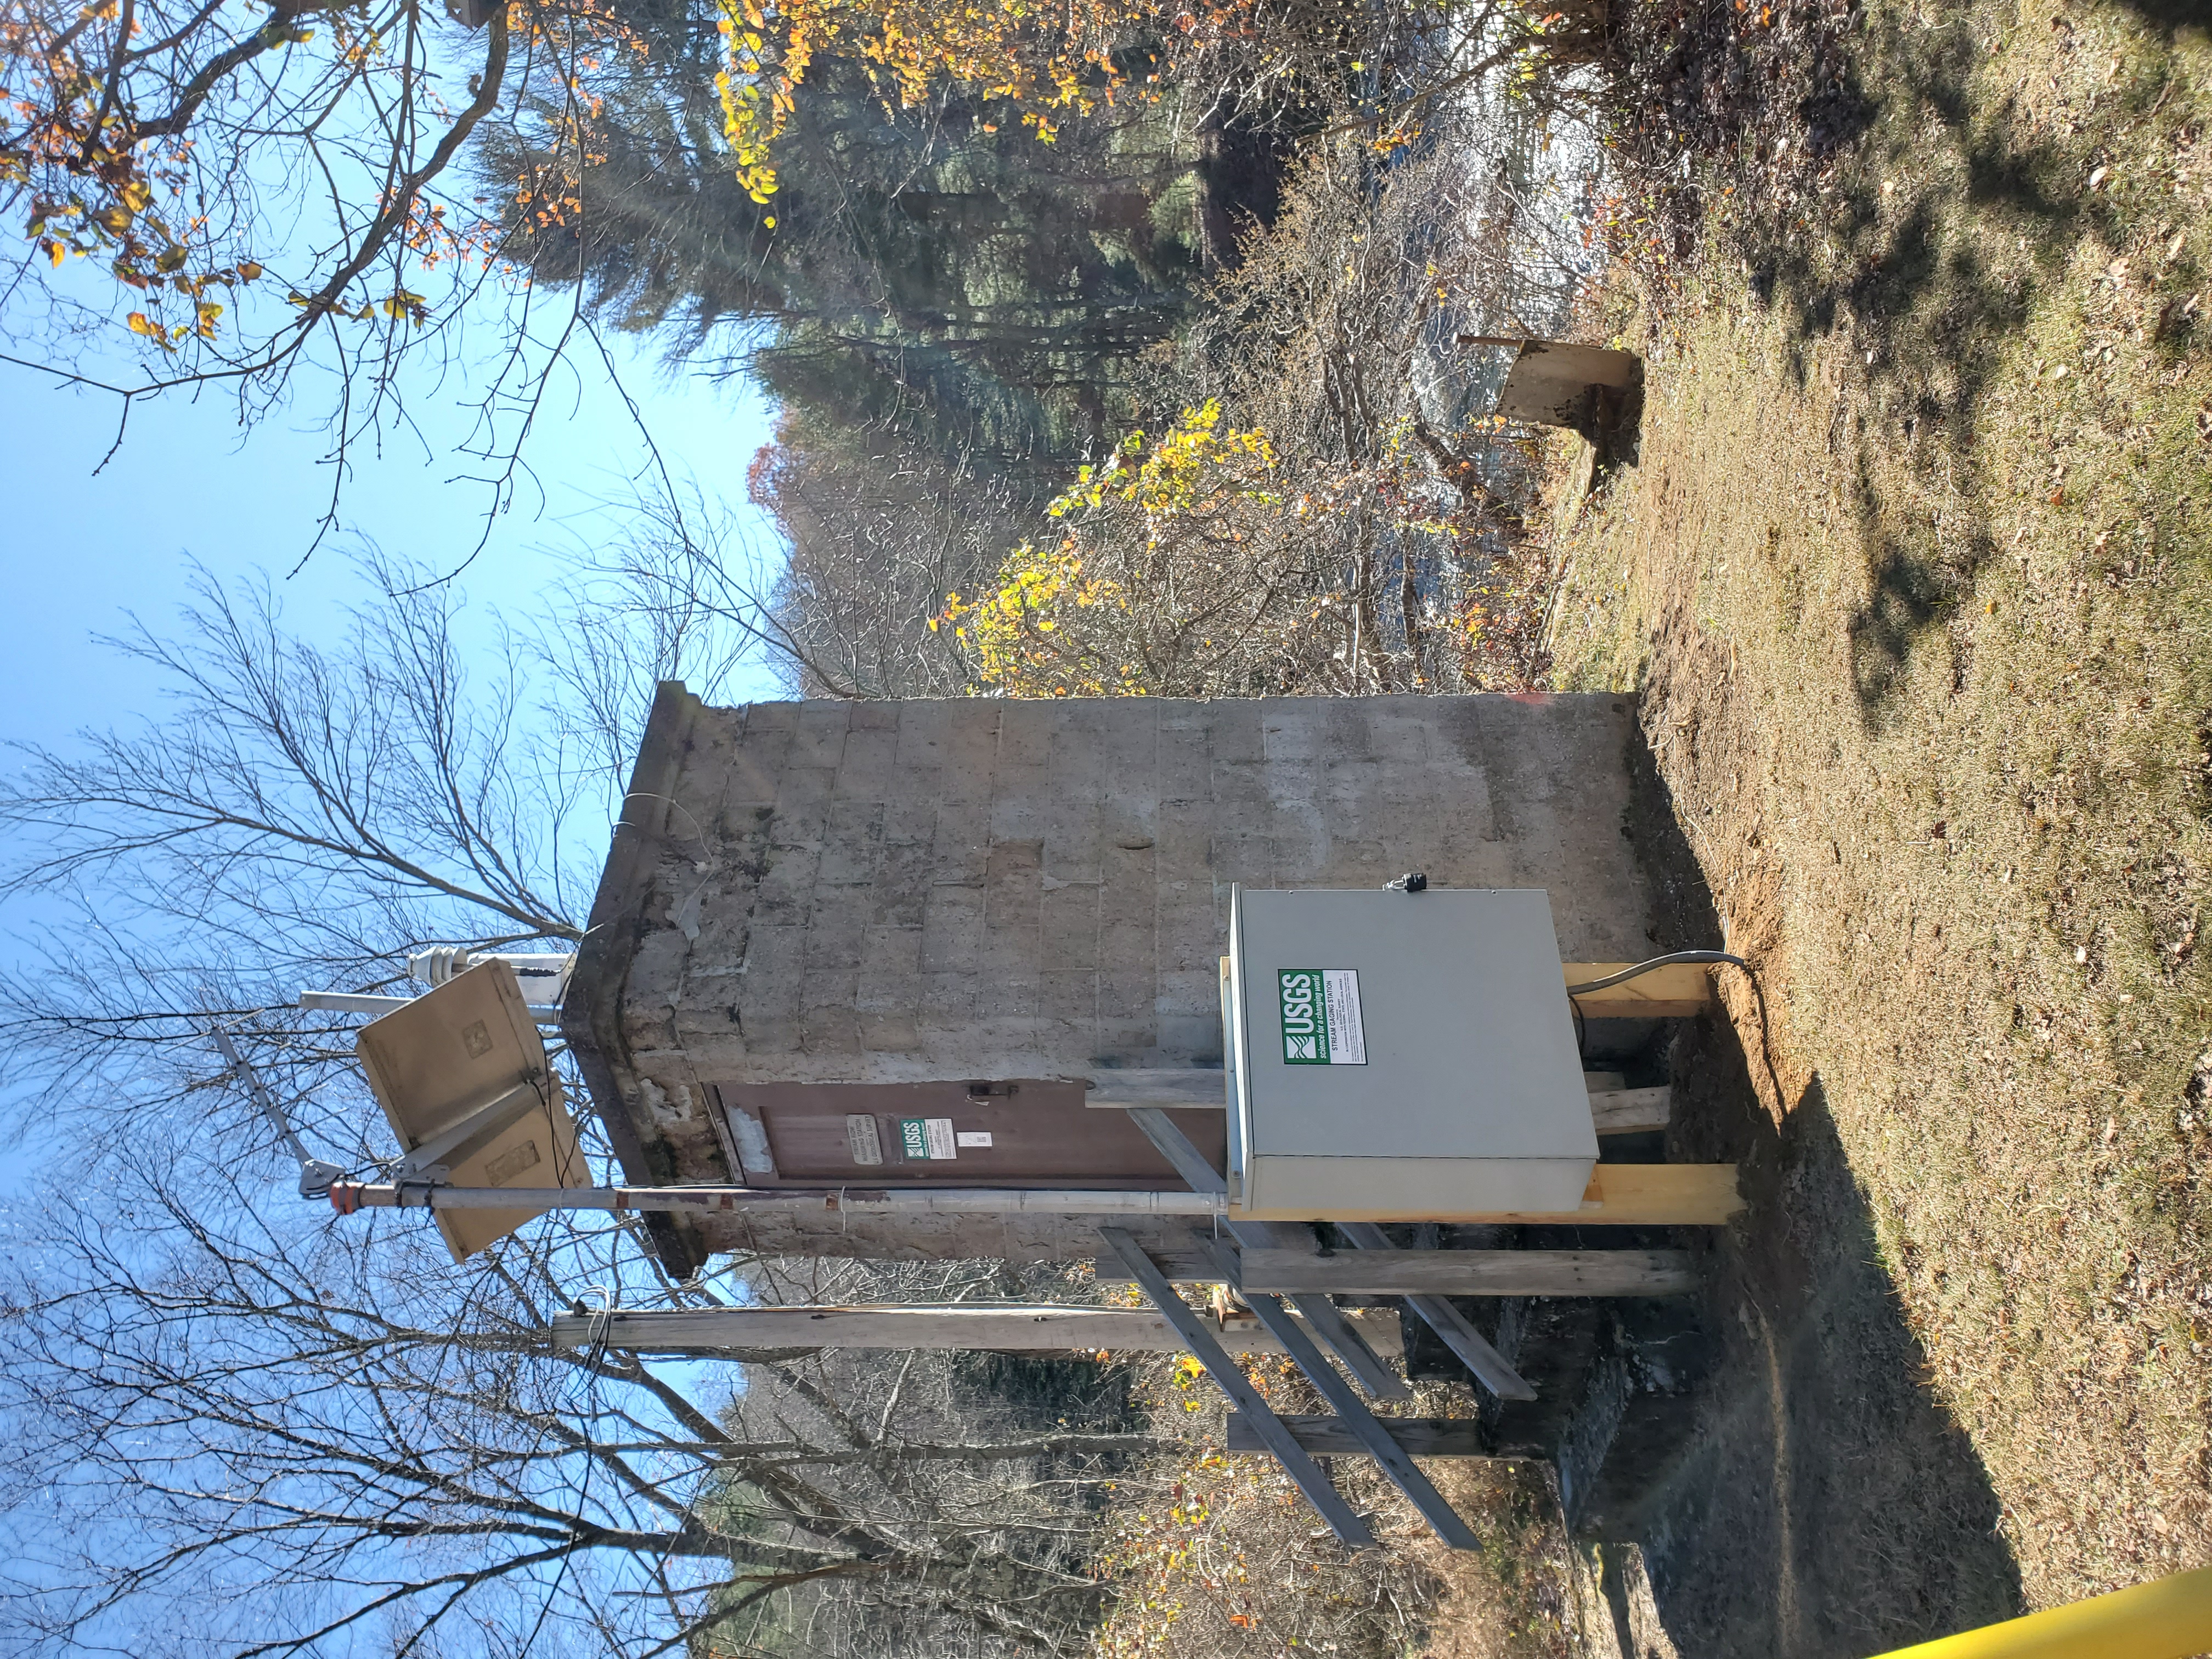
LOCATION.--Lat 39°25'17.7", long 79°25'25.1", Garrett County, MD, Hydrologic Unit 05020006,
   on left bank 200 ft downstream from Baltimore and Ohio Railroad bridge, 250 ft downstream from
   Little Youghiogheny River, 1.2 mi northwest of Oakland, and 1.5 mi upstream from Dunkard Lick
   Run.
DRAINAGE AREA.--134 mi2.
PERIOD OF RECORD.--August 1941 to current year.
REVISIONS HISTORY.--WSP 1113: 1947(M).
GAGE.--Water-stage recorder, crest-stage gage and concrete control. Datum of gage is 2,353.14 ft above
   North American Vertical Datum of 1988. Prior to Aug. 1, 1946, nonrecording gage at bridge 200 ft
   upstream at datum 0.47 ft higher.
REMARKS.--Town of Oakland diverted an average of 0.4 ft3/s for water supply. The diversion is
   returned upstream from station as sewage. U.S. Army Corps of Engineers satellite data-collection
   platform at station.
EXTREMES FOR PERIOD OF RECORD.--Maximum discharge, 14,100 ft3/s, Jan. 19, 1996, gage height, 13.06 ft;
   minimum discharge, 2.5 ft3/s, Oct. 4, 1953.
EXTREMES OUTSIDE PERIOD OF RECORD.--Flood in March 1936 reached a stage of 15.3 ft, from floodmarks.
COOPERATION.--Funding for the operation of this station is provided by the Maryland Department
   of the Environment, the U.S. Army Corps of Engineers, and the U.S. Geological Survey.
| Boating safety tips |
Summary of all available data for this site
Instantaneous-data availability statement
![Graph of Precipitation, total, inches, [Pluvio]](https://natwebcaww01.wr.usgs.gov/nwisweb/data/img/USGS.03075500.316136.00045..20240412.20240419..0..gif)

