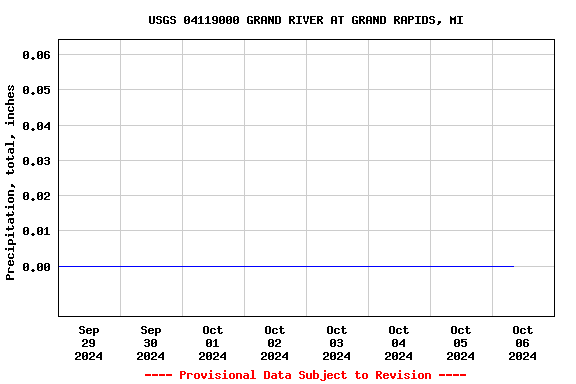
Most recent instantaneous value: 0.00 10-06-2024 06:00 EST
See this graph on the Monitoring Location Pages
Station is a Federal Priority Streamgage and is operated as part of the Groundwater and Streamflow Information Program.
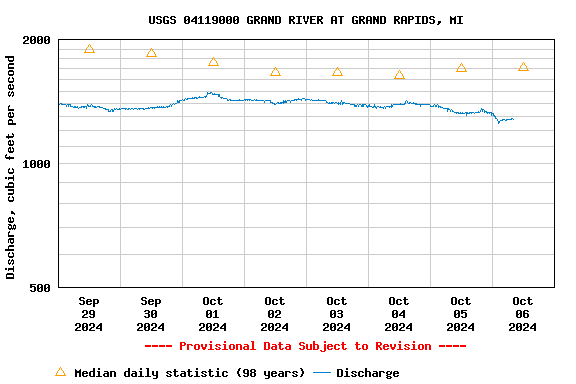
| Min (1931) | 25th percen- tile | Most Recent Instantaneous Value Oct 6 | Median | 75th percen- tile | Mean | Max (1987) |
|---|---|---|---|---|---|---|
| 770 | 1250 | 1280 | 1710 | 2630 | 2700 | 27200 |
![]() U.S. Department of the Interior |
U.S. Geological Survey
U.S. Department of the Interior |
U.S. Geological Survey
Title: USGS Current Conditions for Michigan
URL:
Page Contact Information: Michigan Water Data Support Team
Page Last Modified: 2024-10-06 08:01:38 EDT
2.72 2.03 caww02