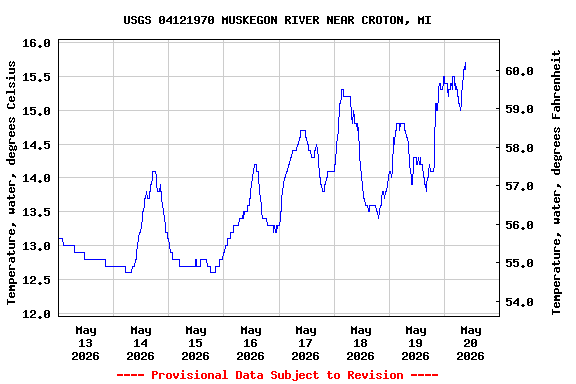
USGS 04121970 MUSKEGON RIVER NEAR CROTON, MI

PROVISIONAL DATA SUBJECT TO REVISION

Click to hidestation-specific text
This station managed by the GRAYLING FIELD OFFICE.

Available Parameters Available Period
  
2007-10-01  2025-11-14
2014-08-13  2025-11-14
1995-10-01  2025-11-14
2017-10-01  2025-11-14
2007-10-01  2025-11-14
2020-07-30  2025-11-14


 (7)
 

  -- or --


Summary of all available data for this site
Instantaneous-data availability statement


Temperature, water, degrees Celsius

Most recent instantaneous value: 9.1 11-14-2025   06:00 EST
Graph of

Add up to 2 more sites and replot for "Temperature, water, degrees Celsius"

?


Create presentation-quality / stand-alone graph.   Subscribe to WaterAlert      

See this graph on the Monitoring Location Pages


Precipitation, total, inches

Most recent instantaneous value: 0.00 11-14-2025   06:00 EST
Graph of  Precipitation, total, inches

Add up to 2 more sites and replot for "Precipitation, total, inches"

?


Create presentation-quality / stand-alone graph.   Subscribe to WaterAlert      

See this graph on the Monitoring Location Pages


Discharge, cubic feet per second

Most recent instantaneous value: 1240 11-14-2025   06:00 EST
Graph of

Add up to 2 more sites and replot for "Discharge, cubic feet per second"

?


Create presentation-quality / stand-alone graph.   Subscribe to WaterAlert      

See this graph on the Monitoring Location Pages


Daily discharge, cubic feet per second -- statistics for Nov 14 based on 30 water years of record more
Min
(2008)
Most Recent
Instantaneous
Value Nov 14
25th
percen-
tile
Mean Median 75th
percen-
tile
Max
(2007)
1100 1240 1440 1790 1810 2080 2570


Gage height, feet

Most recent instantaneous value: 4.99 11-14-2025   06:00 EST
Graph of

Add up to 2 more sites and replot for "Gage height, feet"

?


Create presentation-quality / stand-alone graph.   Subscribe to WaterAlert      

See this graph on the Monitoring Location Pages


Dissolved oxygen, water, unfiltered, milligrams per liter

Most recent instantaneous value: 10.3 11-14-2025   06:00 EST
Graph of  Dissolved oxygen, water, unfiltered, milligrams per liter

Add up to 2 more sites and replot for "Dissolved oxygen, water, unfiltered, milligrams per liter"

?


Create presentation-quality / stand-alone graph.   Subscribe to WaterAlert      

See this graph on the Monitoring Location Pages


Stream water level elevation above NAVD 1988, in feet

Most recent instantaneous value: 680.20 11-14-2025   06:00 EST
Graph of  Stream water level elevation above NAVD 1988, in feet

Add up to 2 more sites and replot for "Stream water level elevation above NAVD 1988, in feet"

?


Create presentation-quality / stand-alone graph.   Subscribe to WaterAlert      

See this graph on the Monitoring Location Pages