PROVISIONAL DATA SUBJECT TO REVISION
Click to hidestation-specific text
 Operated in cooperation with the Rice Creek Watershed
District Operated in cooperation with the Rice Creek Watershed
District |
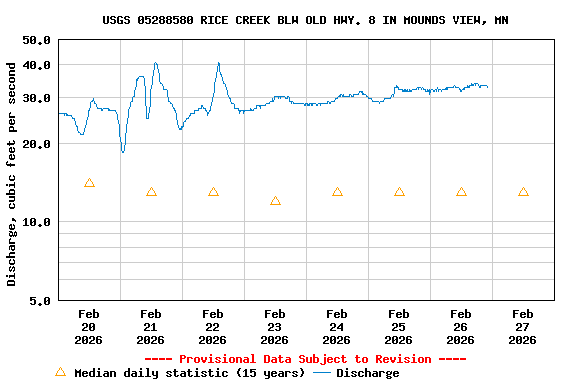
- USGS WaterWatch's "Site Dashboard" provides seasonal and other context-oriented information about current and historical streamflow. /strong>
-
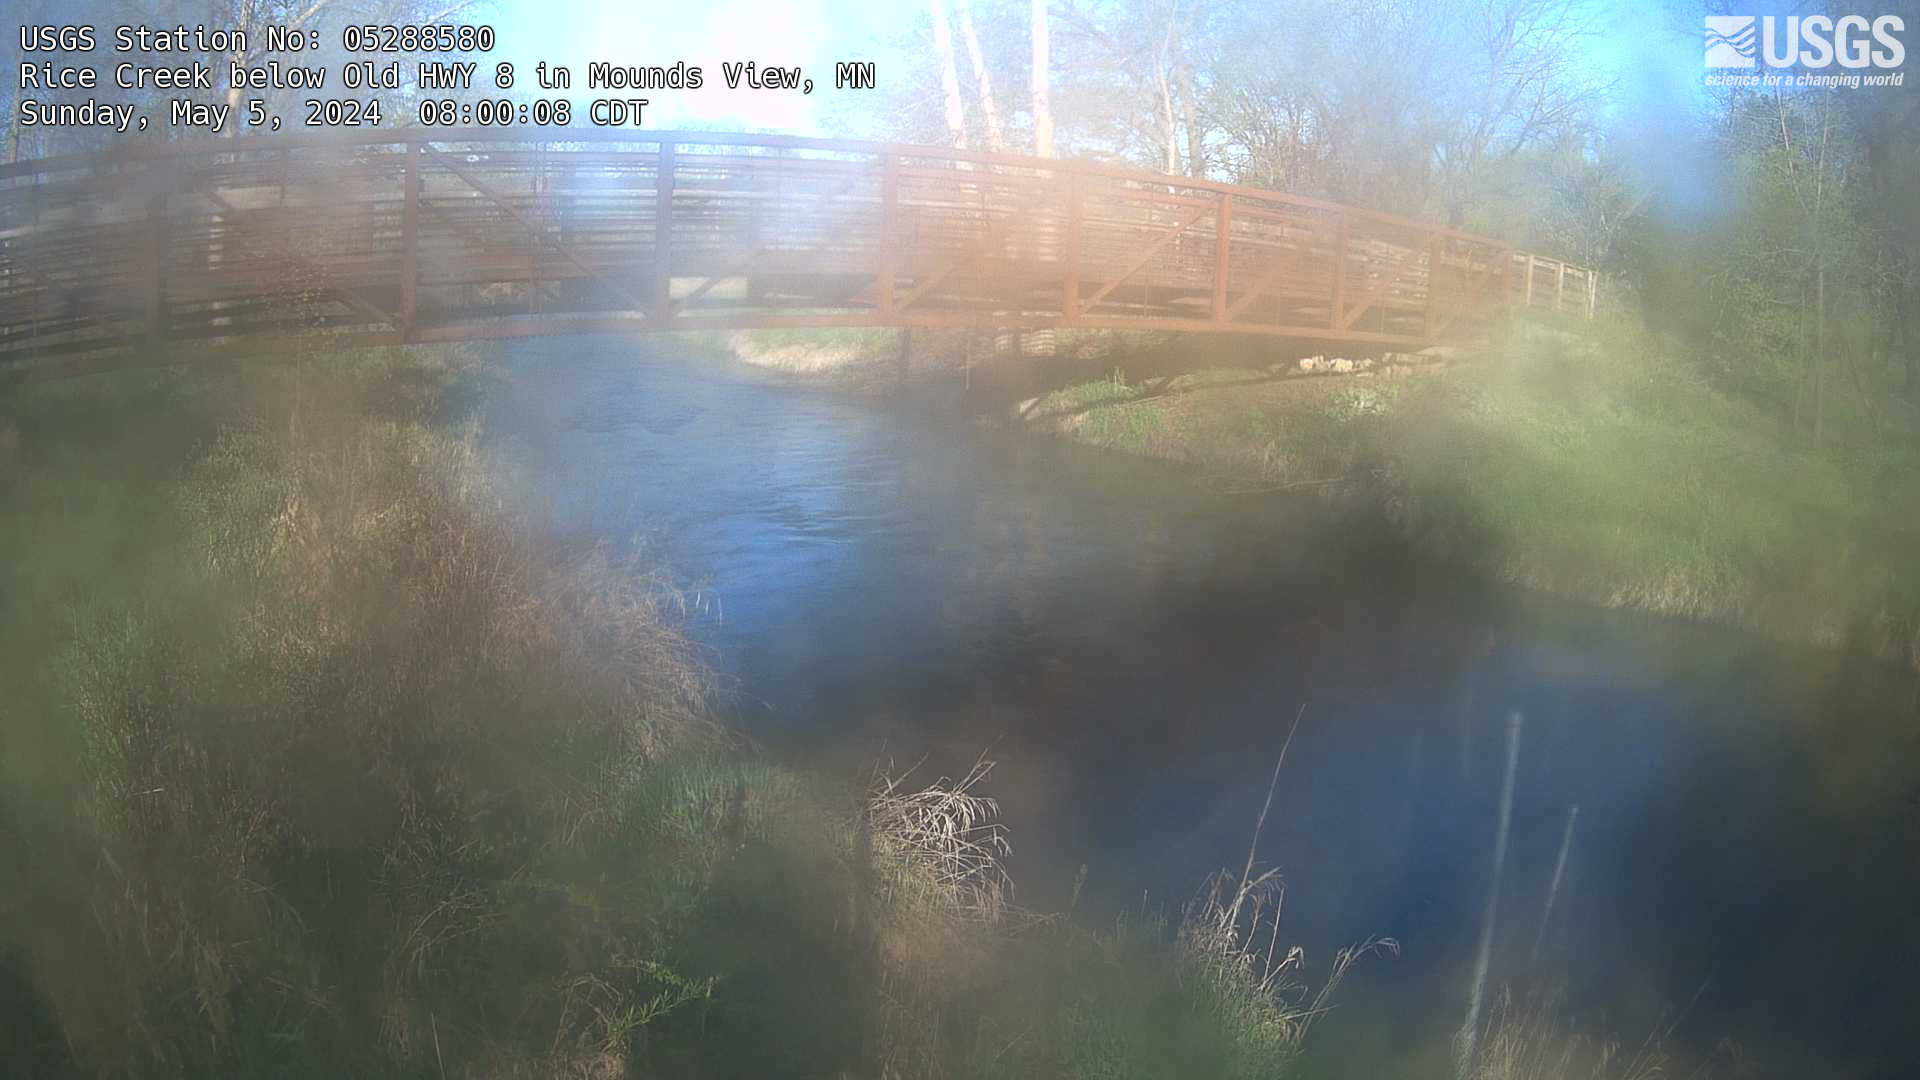
Webcam images help USGS staff monitor river conditions, such as when backwater from ice may be affecting discharge. Click on the image below to download or view larger and interactive-hydrograph versions from the USGS HIVIS web page.
-
Summary of all available data for this site
Instantaneous-data availability statement