USGS 12352500 Bitterroot River near Missoula MT

PROVISIONAL DATA SUBJECT TO REVISION

Click to hidestation-specific text
Flood Tracking - Stage Flood Tracking - Discharge Gage-height Corrections Base Rating Shifted Rating
(About shift-adjusted ratings).
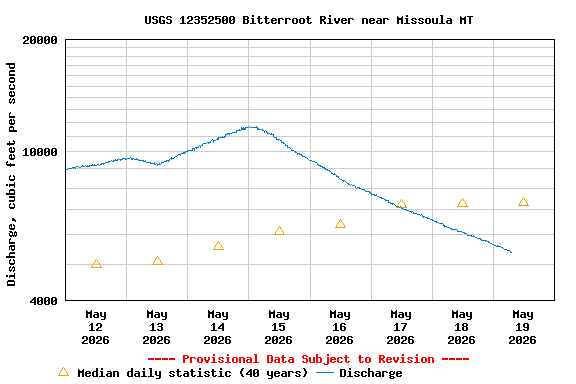
Station operated by the USGS Wyoming-Montana Water Science Center as part of the Federal Priority Streamgages network and in cooperation with Montana Fish, Wildlife, and Parks and the USGS Cooperative Matching Funds program.
Leaving USGS: National Weather Service forecast. U.S. Coast Guard boating safety tips.
This station managed by the Helena Field Unit.

Available Parameters Available Period
  
2012-07-01  2025-11-04
1991-10-01  2025-11-04
2007-10-01  2025-11-04


 (7)
 

  -- or --


Summary of all available data for this site
Instantaneous-data availability statement


Temperature, water, degrees Celsius

Most recent instantaneous value: 5.9 11-04-2025   02:45 MST
Graph of  Temperature, water, degrees Celsius

Add up to 2 more sites and replot for "Temperature, water, degrees Celsius"

?


Create presentation-quality / stand-alone graph.   Subscribe to WaterAlert      

See this graph on the Monitoring Location Pages


Discharge, cubic feet per second

Most recent instantaneous value: 968 11-04-2025   02:45 MST
Graph of  Discharge, cubic feet per second

Add up to 2 more sites and replot for "Discharge, cubic feet per second"

?


Create presentation-quality / stand-alone graph.   Subscribe to WaterAlert      

See this graph on the Monitoring Location Pages


Daily discharge, cubic feet per second -- statistics for Nov 4 based on 42 water years of record more
Min
(1992)
25th
percen-
tile
Most Recent
Instantaneous
Value Nov 4
Median Mean 75th
percen-
tile
Max
(2019)
578 833 968 1040 1110 1390 1950


Gage height, feet

Most recent instantaneous value: 3.39 11-04-2025   02:45 MST
Graph of  Gage height, feet

Add up to 2 more sites and replot for "Gage height, feet"

?


Create presentation-quality / stand-alone graph.   Subscribe to WaterAlert      

See this graph on the Monitoring Location Pages