USGS 03446000 MILLS RIVER NEAR MILLS RIVER, NC

PROVISIONAL DATA SUBJECT TO REVISION

Click to hidestation-specific text
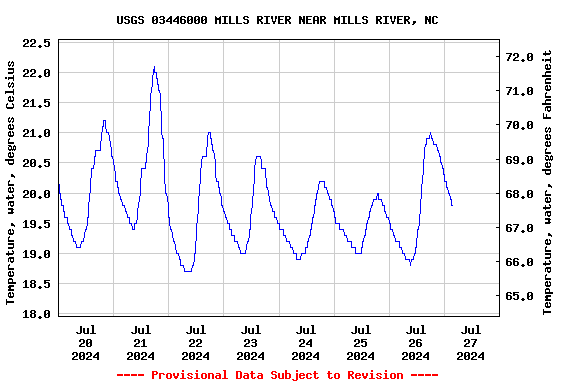
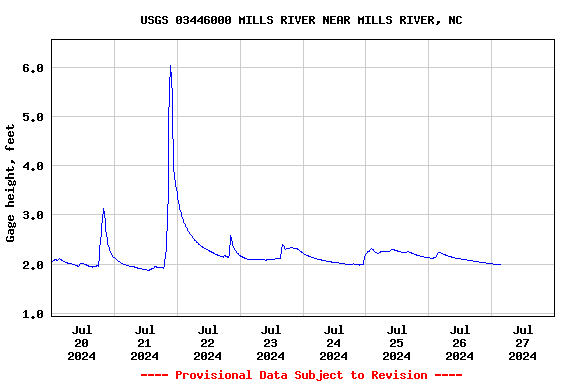
This station managed by the South Atlantic WSC Asheville Field Office.

Available Parameters Available Period
  
2012-08-04  2024-07-27
1985-10-01  2024-07-27
2007-10-01  2024-07-27
2021-10-01  2024-07-27


 (7)
 

  -- or --


Summary of all available data for this site
Instantaneous-data availability statement


Temperature, water, degrees Celsius

Most recent instantaneous value: 20.1 07-27-2024   01:30 EDT
Graph of  Temperature, water, degrees Celsius

Add up to 2 more sites and replot for "Temperature, water, degrees Celsius"

?


Create presentation-quality / stand-alone graph.   Subscribe to WaterAlert      

See this graph on the Monitoring Location Pages


Discharge, cubic feet per second

Most recent instantaneous value: 112 07-27-2024   01:30 EDT
Graph of

Add up to 2 more sites and replot for "Discharge, cubic feet per second"

?


Create presentation-quality / stand-alone graph.   Subscribe to WaterAlert      

See this graph on the Monitoring Location Pages


Daily discharge, cubic feet per second -- statistics for Jul 27 based on 92 water years of record more
Min
(1988)
25th
percen-
tile
Median Most Recent
Instantaneous
Value Jul 27
Mean 75th
percen-
tile
Max
(1973)
36.0 68 95 112 113 138 468


Gage height, feet

Most recent instantaneous value: 2.00 07-27-2024   01:30 EDT
Graph of  Gage height, feet

Add up to 2 more sites and replot for "Gage height, feet"

?


Create presentation-quality / stand-alone graph.   Subscribe to WaterAlert      

See this graph on the Monitoring Location Pages


Stream water level elevation above NAVD 1988, in feet

Most recent instantaneous value: 2090.39 07-27-2024   01:30 EDT
Graph of  Stream water level elevation above NAVD 1988, in feet

Add up to 2 more sites and replot for "Stream water level elevation above NAVD 1988, in feet"

?


Create presentation-quality / stand-alone graph.   Subscribe to WaterAlert      

See this graph on the Monitoring Location Pages