PROVISIONAL DATA SUBJECT TO REVISION
Click to hidestation-specific text
| Funding for this site is provided by | |
 |
|
| Papio-Missouri River Natural Resources District |
National Streamflow Information Program |
 WaterNow – get the latest
gage data from your mobile phone or email.
WaterNow – get the latest
gage data from your mobile phone or email.

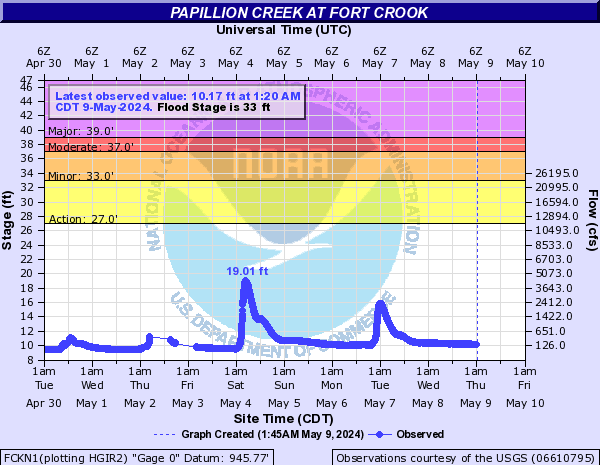
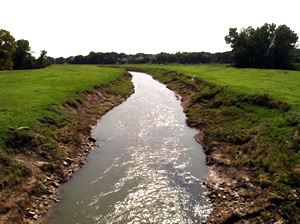
Downstream view near USGS gaging station: Papillion Creek at Fort Crook, Nebr.
|
|
Missouri
River Basin (Niobrara River-Platte River) |
| If precipitation, water temperature, soil temperature and (or) air temperature are displayed for this station, then these values are temporary and will only be displayed for 120 days. The temporary classification means that the routine inspections and other quality assurance measures that would allow these data to be published are not routinely performed for this station. |
This station managed by the Lincoln Field Office.
Summary of all available data for this site
Instantaneous-data availability statement
![Graph of Precipitation, total, inches, [Temporary Data]](https://natwebsdww01.cr.usgs.gov/nwisweb/data/img/USGS.06610795.94452.00045..20240409.20240416..0..gif)

