LOCATION.--Lat 42°49'49.9", long
73°55'50.7" referenced to North American Datum of
1983, Schenectady County, NY, Hydrologic Unit 02020004, on left
bank 12 ft downstream from bridge on Freeman's Bridge Road,
1.2 mi north of Schenectady.
DRAINAGE AREA.--3,310 mi².
PERIOD OF RECORD.--Occasional low-flow and/or
miscellaneous discharge measurements, water years 1899-1901,
1920, 1953, 1966-67. August 2011 to current year.
GAGE.--Water-stage recorder and acoustic velocity meter.
Datum of gage is 200.00 ft above NGVD of 1929 and 199.46 ft
above NAVD of 1988. Prior to Oct. 1, 2013, datum of gage was
199.74 ft above NGVD of 1929, not 200.00 ft above NGVD of 1929
as previously published.
REMARKS.--Considerable regulation of stage by Lock 8 on
the Erie (Barge) Canal about 3.8 mi upstream and Vischer Ferry
Dam hydroelectric facility about 6.9 mi downstream.
Water Years 2014-22: Records fair except those for estimated
daily discharges, which are poor.
EXTREMES FOR PERIOD OF RECORD.--Maximum discharge
130,000 ft³/s Aug. 29, 2011, gage height 26.15 ft, present
datum; minimum discharge not determined; minimum gage height,
7.92 ft, Dec. 31, 2017, result of freezeup.
EXTREMES OUTSIDE PERIOD OF RECORD.--An extreme flood
occurred sometime from 1860-65 with a depth of 12 ft on the
Cohoes dam and a peak discharge estimated to be at least
200,000 ft³/s (from New York State Museum Bulletin 85).

 Site Information
 WaterAlert – get an
email or text (SMS) alert based on your chosen threshold.
WaterAlert – get an
email or text (SMS) alert based on your chosen threshold.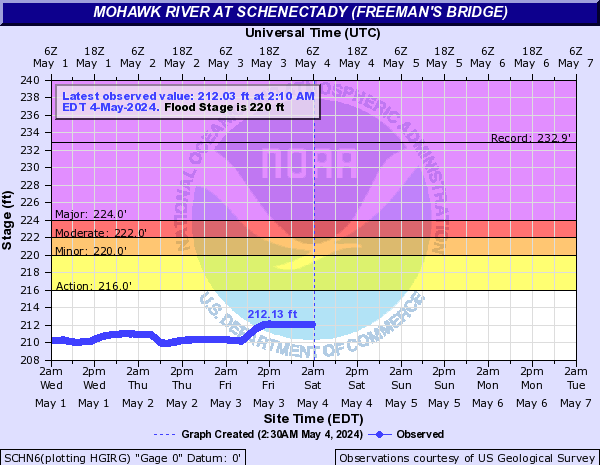
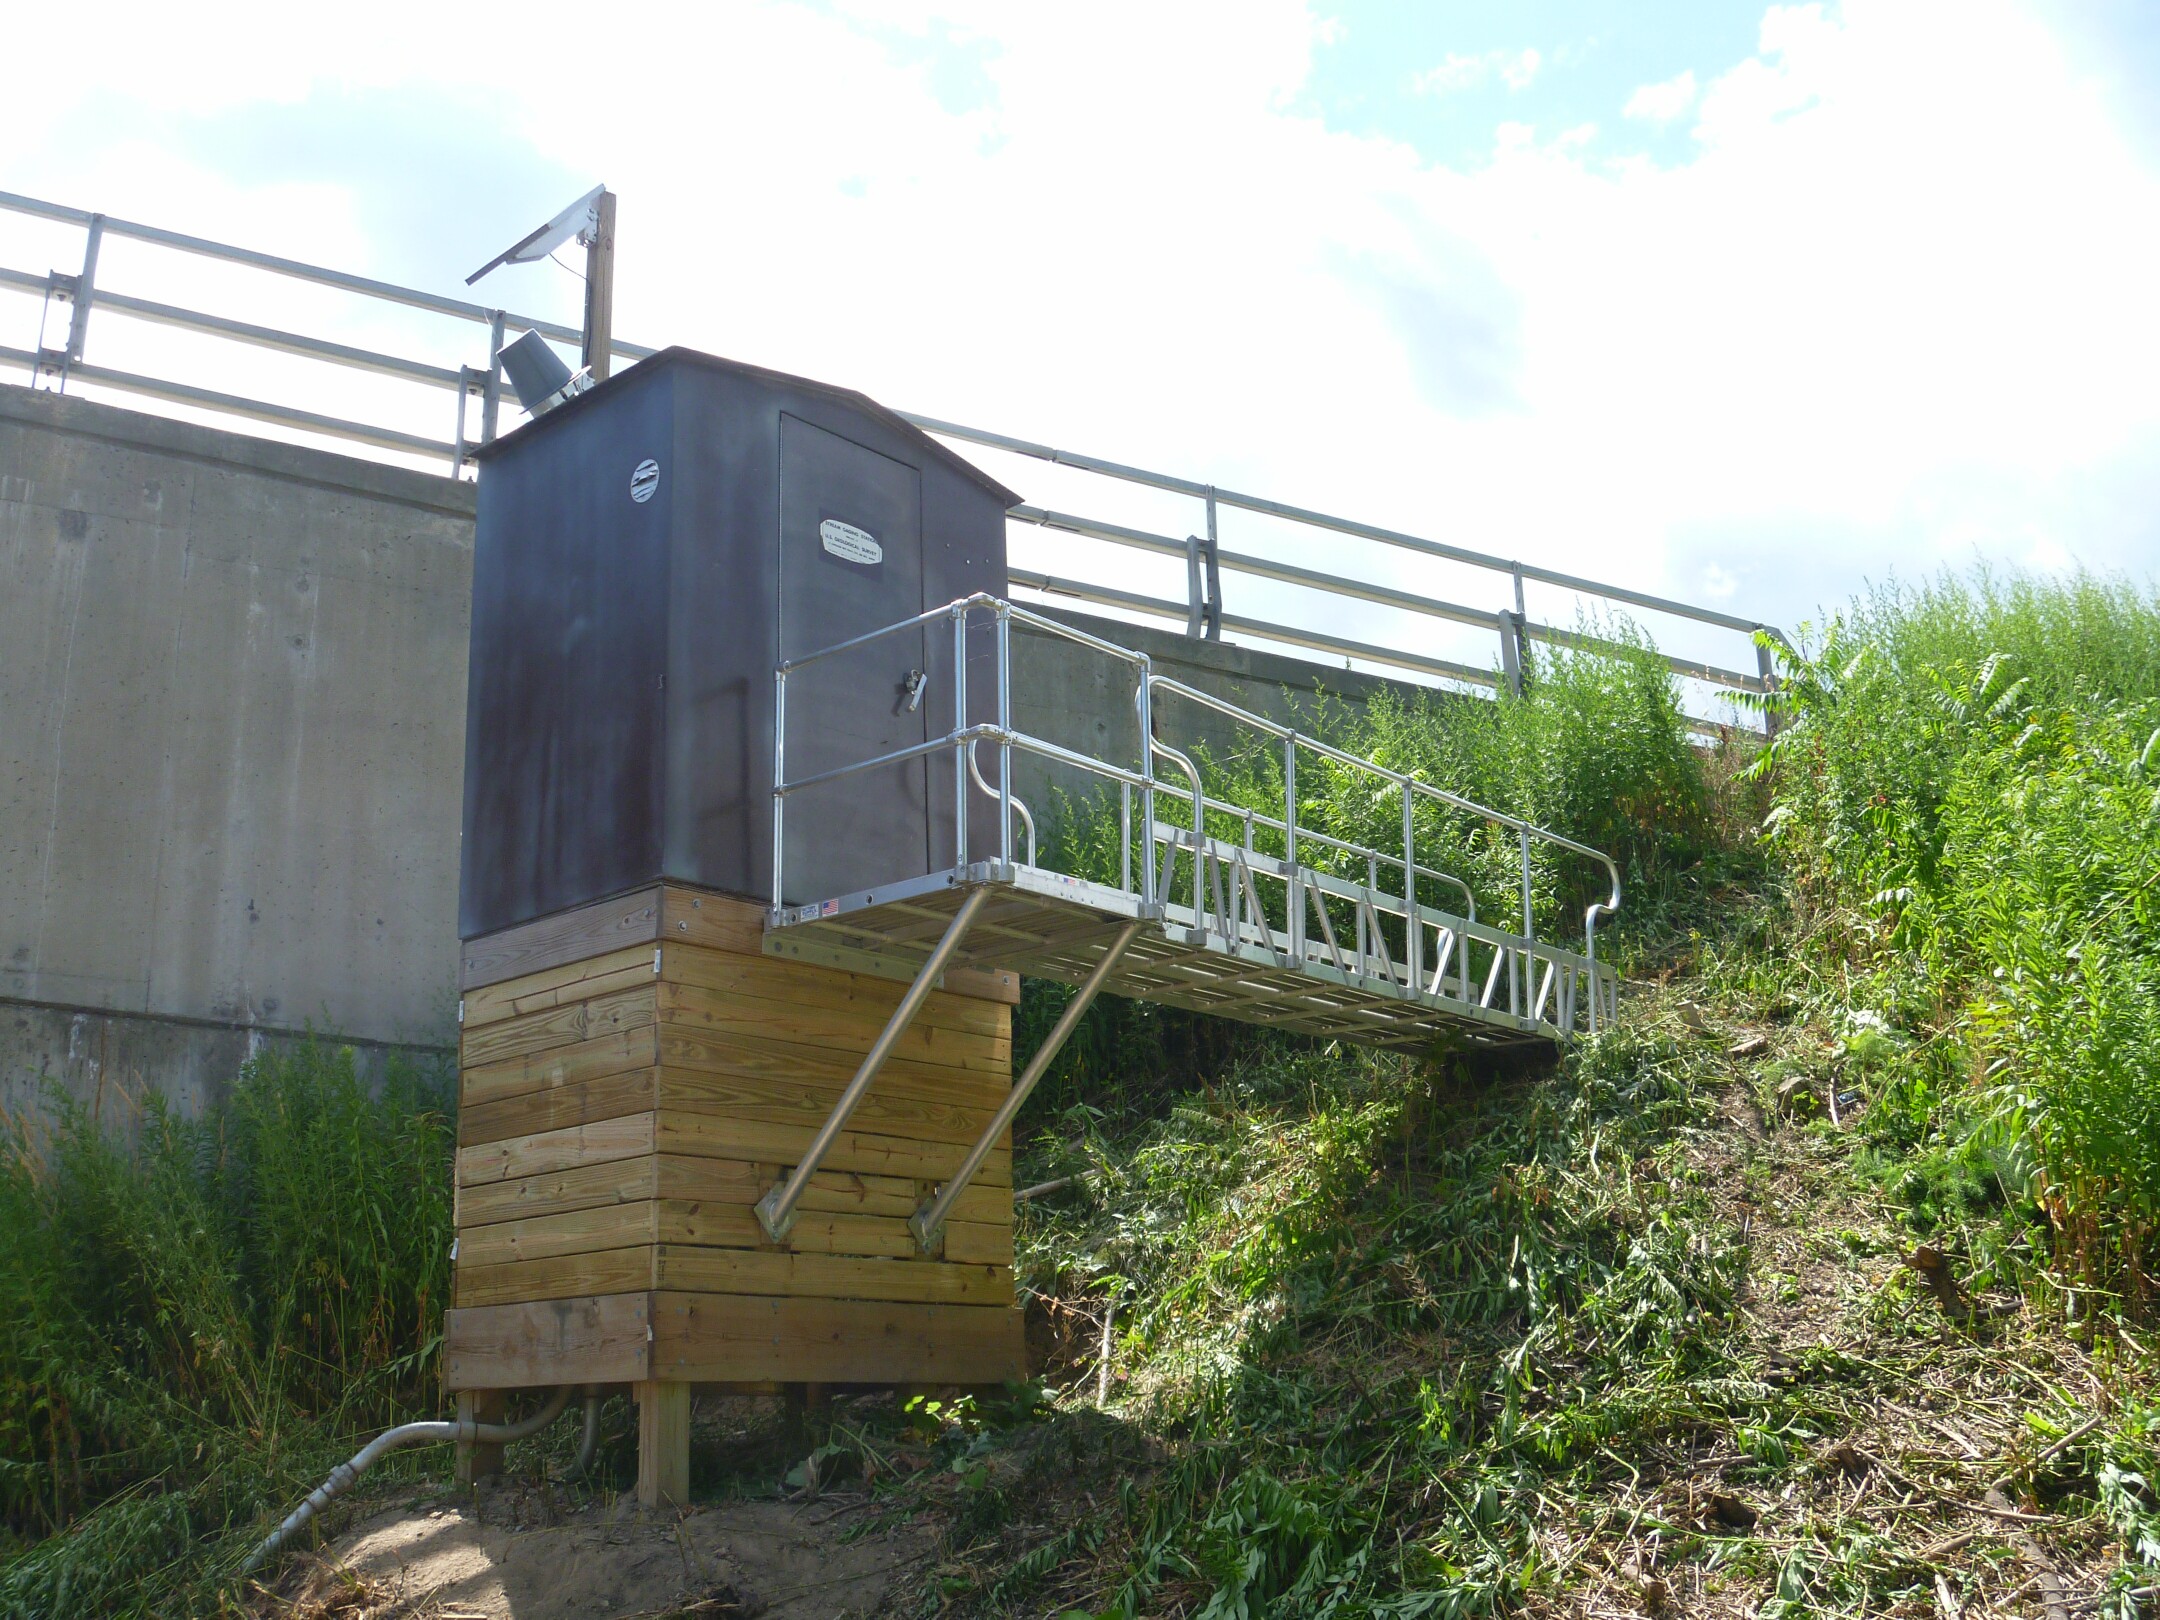 Station image