Warning: Javascript must be enabled to use all the features on this page!


Page Loading - Please Wait...

Click to hideNews Bulletins

USGS 01478245 White Clay Creek near Strickersville, PA

PROVISIONAL DATA SUBJECT TO REVISION

Click to hidestation-specific text


Station gage imageSTATION.--
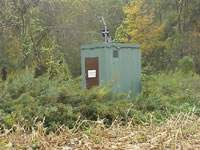
01478245 WHITE CLAY CREEK NEAR STRICKERSVILLE, PA
LOCATION.--Lat 39`44'51", long 75`46'15", Chester County, Hydrologic Unit 02040205, on right bank 0.1 mi downstream from West Branch White Clay Creek, in the White Clay Creek State Preserve, and 1.5 mi northeast of Strickersville.
DRAINAGE AREA.--59.2 square miles.
PERIOD OF RECORD.--August 1996 to current year.
GAGE.--Water-stage recorder, crest-stage gage, and water-quality monitor. Elevation of gage is 113.4 ft. above North American Vertical Datum of 1988, from single-base GNSS rapid static sruvey. Satellite telemetry at station. Prior to March 16, 2022, the datum of gage was erroneously reported as 120 ft above National Geodetic Vertical Datum of 1929.
COOPERATION.--Station established and maintained by the U.S. Geological Survey in cooperation with the Pennsylvania Department of Environmental Protection.
GAGE HEIGHTS OF IMPORTANCE.-
Supplied by USGS: Data transmitter operational limit - 17.0 ft;
Supplied by NWS: Action stage-9 ft; Flood stage-9.5 ft; Moderate flood stage-11 ft; Major flood stage-12 ft.
This station managed by the PAWSC Downingtown Field Office.

Available Parameters Period of Record
  
2019-10-01  2024-04-19
1996-08-01  2024-04-18
2019-10-02  2024-04-18
2011-11-16  2024-04-18
2011-11-16  2016-09-29
2011-11-16  2024-04-18
2021-04-20  2024-04-18
2011-11-16  2024-04-18


 (365)
 

  -- or --


Summary of all available data for this site
Instantaneous-data availability statement


Temperature, water, degrees Celsius


Graph of DAILY Temperature, water, degrees Celsius

Add up to 2 more sites and replot for "Temperature, water, degrees Celsius"

?


Create presentation-quality graph.  


Discharge, cubic feet per second


Graph of DAILY Discharge, cubic feet per second

Add up to 2 more sites and replot for "Discharge, cubic feet per second"

?


Create presentation-quality graph.  


Specific conductance, water, unfiltered, microsiemens per centimeter at 25 degrees Celsius


Graph of DAILY Specific conductance, water, unfiltered, microsiemens per centimeter at 25 degrees Celsius

Add up to 2 more sites and replot for "Specific conductance, water, unfiltered, microsiemens per centimeter at 25 degrees Celsius"

?


Create presentation-quality graph.  


Turbidity, water, unfiltered, monochrome near infra-red LED light, 780-900 nm, detection angle 90 +-2.5 degrees, formazin nephelometric units (FNU)


Graph of DAILY Turbidity, water, unfiltered, monochrome near infra-red LED light, 780-900 nm, detection angle 90 +-2.5 degrees, formazin nephelometric units (FNU)

Add up to 2 more sites and replot for "Turbidity, water, unfiltered, monochrome near infra-red LED light, 780-900 nm, detection angle 90 +-2.5 degrees, formazin nephelometric units (FNU)"

?


Create presentation-quality graph.  


Suspended sediment load, water, unfiltered, computed, the product of regression-computed suspended sediment concentration and streamflow, short tons per day


Graph of DAILY Suspended sediment load, water, unfiltered, computed, the product of regression-computed suspended sediment concentration and streamflow, short tons per day

Add up to 2 more sites and replot for "Suspended sediment load, water, unfiltered, computed, the product of regression-computed suspended sediment concentration and streamflow, short tons per day"

?


Create presentation-quality graph.  


Chloride, water, unfiltered, milligrams per liter


Graph of DAILY Chloride, water, unfiltered, milligrams per liter

Add up to 2 more sites and replot for "Chloride, water, unfiltered, milligrams per liter"

?


Create presentation-quality graph.  


Suspended sediment concentration, water, unfiltered, estimated by regression equation, milligrams per liter


Graph of DAILY Suspended sediment concentration, water, unfiltered, estimated by regression equation, milligrams per liter

Add up to 2 more sites and replot for "Suspended sediment concentration, water, unfiltered, estimated by regression equation, milligrams per liter"

?


Create presentation-quality graph.