Funding for this site is provided by:
 STATION.
--01518000 TIOGA RIVER AT TIOGA, PA
LOCATION.--Lat 41`54'30", long
77`07'47", Tioga County, Hydrologic Unit 02050104, on left
bank 130 ft upstream from highway bridge on Township Route 667 at
Tioga, 0.8 mi upstream from Crooked Creek, and 0.9 mi downstream from
Tioga Dam.
DRAINAGE AREA.--282 square miles.
PERIOD OF RECORD.--June 1938 to current year. Prior to
October 1938 monthly discharge only, published in WSP 1302.
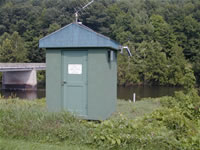
GAGE.--Water-stage recorder and crest-stage gage.
Datum of gage is 1,020.59 ft above North American Vertical Datum of
1988 (from benchmark). Prior to Sept. 9, 1953, at site 20 ft upstream
at datum 2.11 ft higher. Sept. 9, 1953 to Aug. 10, 1954, at site 130 ft
downstream at present datum. Prior to March 12, 2024, the datum of gage
was reported as 1,021.07 ft above National Geodetic Vertical Datum of
1929. Satellite telemetry at station.
COOPERATION.--Station established and maintained by
the U.S. Geological Survey. Funding for the operation of this station
is provided by the U.S. Army Corps of Engineers, Baltimore District,
the Pennsylvania Department of Environmental Protection, and the U.S.
Geological Survey.
REMARKS.--Discharges include flow diverted from
Crooked Creek into Tioga River since Oct. 1, 1977. Flow regulated since
November 1979 by Tioga Dam (station 01517900).
GAGE HEIGHTS OF IMPORTANCE.-
Supplied by USGS: Data transmitter operational limit -
23.3 ft;
Supplied by NWS: No flood stage has been determined
for this station.

