LOCATION.--Lat 43°18'49.7", long
78°42'55.5" referenced to North American Datum of
1983, Niagara County, NY, Hydrologic Unit 04130001, on right
bank, 150 ft downstream of dam, 1,000 ft upstream of
Fisherman's Park in Burt, and 1.7 mi upstream of
mouth.
DRAINAGE AREA.--84.8 mi².
PERIOD OF RECORD.--August 2011 to current year.
REVISIONS HISTORY.--Turbidity records for the period
June 7 to Sept. 21, 2022, were revised on Dec. 19, 2022, due to
a calibration correction that was discovered which changed the
required data correction.
GAGE.--Water-stage recorder. Datum of gage is
244.48 ft above NAVD of 1988 and 244.39 ft above IGLD of
1985.
REMARKS.--Considerable regulation by power generation at
Burt Dam, 150 ft upstream.
Water Year 2014: Records poor.
Water Year 2015: Records fair except those for October to
April, which are poor.
Water Year 2016: Records fair except those for estimated daily
discharges, which are poor.
Water Year 2017: Records fair except those for period of
backwater as a result of high water levels on Lake Ontario
between Apr. 14 and Aug. 30, which are poor.
Water Year 2018: Records fair except those for period of
backwater as a result of high water levels on Lake Ontario
between May 12-16 and June 3-8, which are poor.
Water Year 2019: Records fair except those for period of
backwater as a result of high water levels on Lake Ontario
between Apr. 27 and Sept. 30, which are poor.
Water Year 2020: Records fair except those for period of
backwater as a result of high water levels on Lake Ontario
between Apr. 7 and June 24, which are poor.
Water Years 2021-23: Records good except those for estimated
daily discharges, which are poor.
EXTREMES FOR PERIOD OF RECORD.--Maximum discharge, 2,190
ft³/s, May 6, 2017, gage height, 6.65 ft; minimum
discharge, 0.97 ft³/s, Sept. 29, 2017, gage height, 2.35
ft (result of regulation); minimum gage height, 1.93
ft, Nov. 8, 2014, and July 27, 28, 2016, (result of
regulation).
PERIOD OF DAILY RECORD1.--WATER
TEMPERATURE: July 2020 to current year. SPECIFIC
CONDUCTANCE: July 2020 to current year. DISSOLVED
OXYGEN: July 2020 to current year. TURBIDITY: July
2020 to current year.
INSTRUMENTATION1.--Multi-parameter
water-quality sonde measures water temperature, specific
conductance, dissolved oxygen, and turbidity at 15-minute
intervals since July 2020.
EXTREMES FOR PERIOD OF DAILY RECORD1.--WATER
TEMPERATURE: Maximum, 28.1°C, July 9, 2020; minimum, -0.1°C, on
many days.
SPECIFIC CONDUCTANCE: Maximum, 1,490 uS/cm @ 25°C, Feb. 25,
2021; minimum, 351 uS/cm @ 25°C, July 21, 2021, Apr. 6,
2023.
DISSOLVED OXYGEN: Maximum, 15.4 mg/L, Feb. 19, 2022;
minimum, 4.4 mg/L, Aug. 26, 2020.
TURBIDITY: Maximum, 204 FNU, Nov. 9, 2023; minimum, 0.01
FNU, Aug. 27, 2021.
1 Water-Quality Records

 Site Information
 WaterAlert – get an
email or text (SMS) alert based on your chosen threshold.
WaterAlert – get an
email or text (SMS) alert based on your chosen threshold.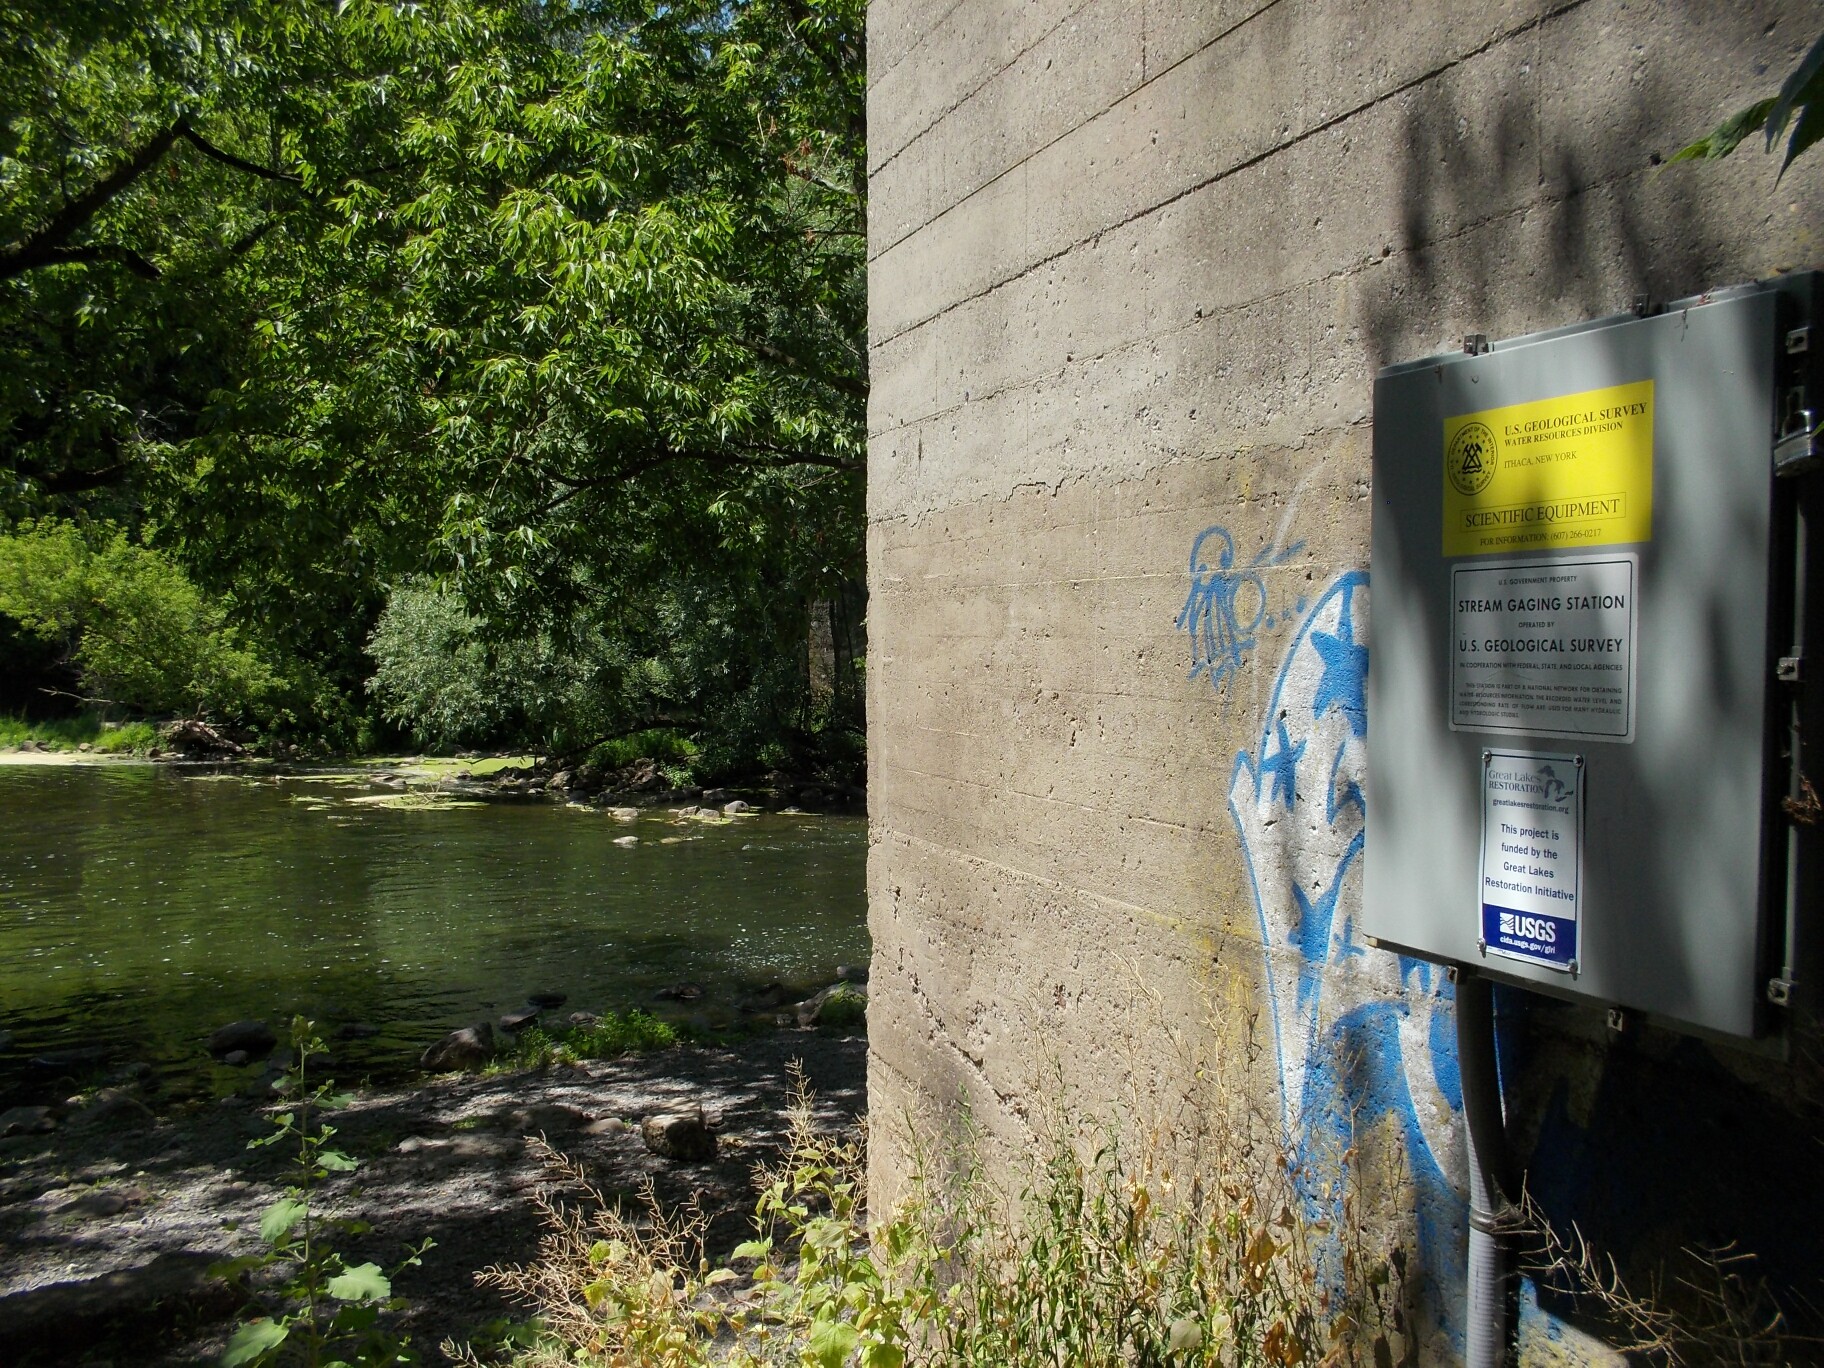 Station image

