Warning: Javascript must be enabled to use all the features on this page!


Page Loading - Please Wait...

Click to hideNews Bulletins

USGS 295949081391400 ST.JOHNS RIVER AT GREEN COVE SPRINGS, FL

PROVISIONAL DATA SUBJECT TO REVISION

Available Parameters Period of Record
  
2004-07-02  2004-09-29
2004-07-02  2004-09-29
2002-03-29  2004-09-29
2002-03-29  2004-06-30
2002-03-29  2004-06-30
2002-03-29  2004-06-30
2002-03-31  2004-06-20
2002-03-31  2004-06-20
2002-03-29  2004-06-30
2002-03-31  2004-06-20


 (1376)
 

  -- or --


Summary of all available data for this site
Instantaneous-data availability statement


Temperature, water, degrees Celsius


Graph of DAILY Temperature, water, degrees Celsius

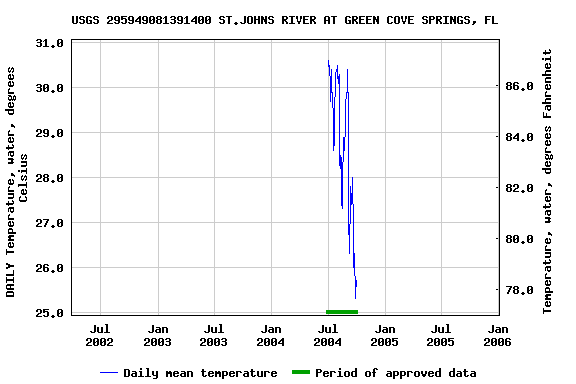
Add up to 2 more sites and replot for "Temperature, water, degrees Celsius"

?


Create presentation-quality graph.  


Temperature, water, degrees Celsius, Top


Graph of DAILY Temperature, water, degrees Celsius

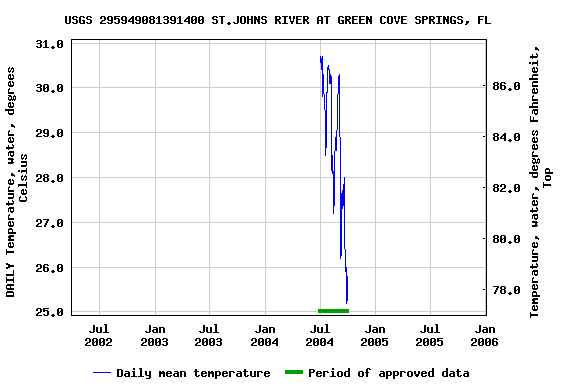
Add up to 2 more sites and replot for "Temperature, water, degrees Celsius, Top"

?


Create presentation-quality graph.  


Temperature, air, degrees Celsius


Graph of DAILY Temperature, air, degrees Celsius

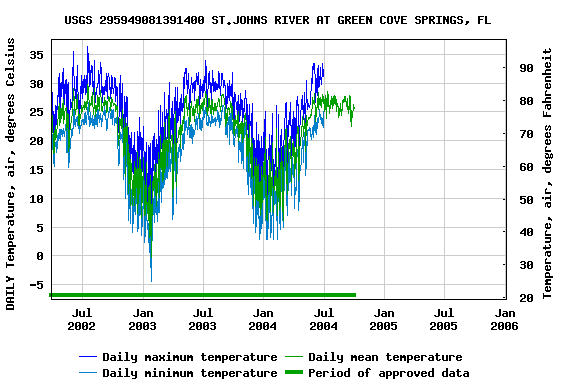
Add up to 2 more sites and replot for "Temperature, air, degrees Celsius"

?


Create presentation-quality graph.  


Relative humidity, percent


Graph of DAILY Relative humidity, percent

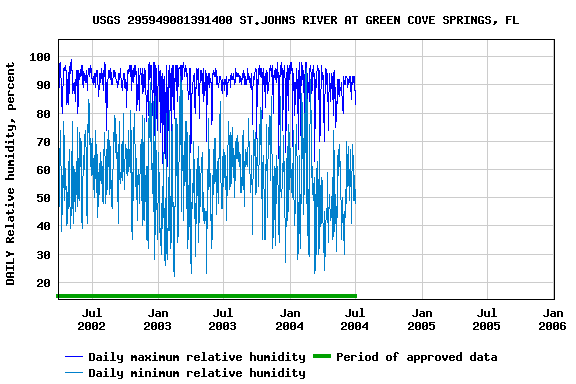
Add up to 2 more sites and replot for "Relative humidity, percent"

?


Create presentation-quality graph.  


Total solar radiation (direct + diffuse radiation on a horizontal surface), watts per square meter


Graph of DAILY Total solar radiation (direct + diffuse radiation on a horizontal surface), watts per square meter

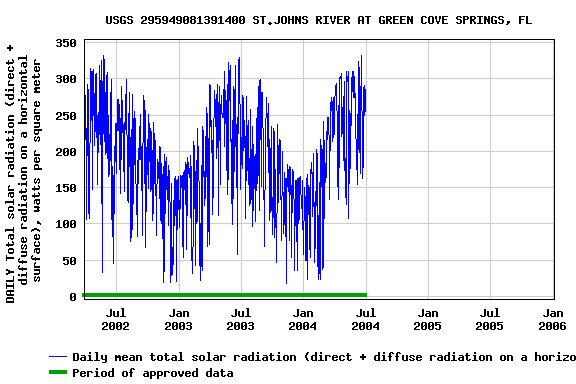
Add up to 2 more sites and replot for "Total solar radiation (direct + diffuse radiation on a horizontal surface), watts per square meter"

?


Create presentation-quality graph.  


Wind speed, meters per second


Graph of DAILY Wind speed, meters per second

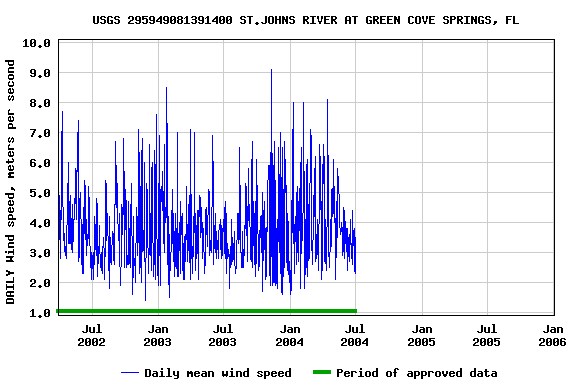
Add up to 2 more sites and replot for "Wind speed, meters per second"

?


Create presentation-quality graph.  


Latent-heat flux, watts per square meter


Graph of DAILY Latent-heat flux, watts per square meter

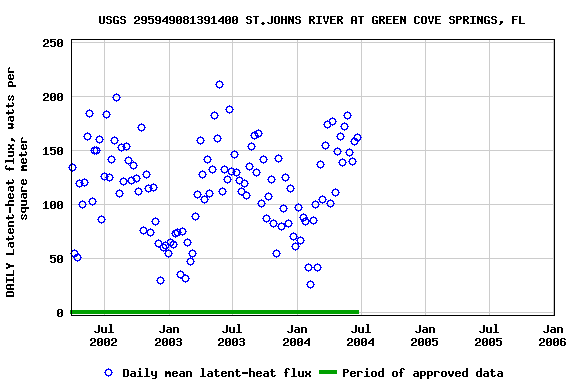
Add up to 2 more sites and replot for "Latent-heat flux, watts per square meter"

?


Create presentation-quality graph.  


Sensible-heat flux, watts per square meter


Graph of DAILY Sensible-heat flux, watts per square meter

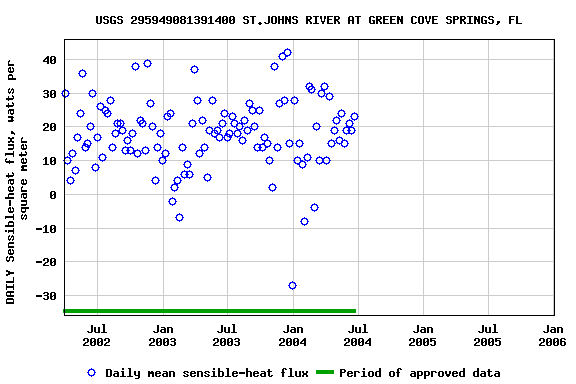
Add up to 2 more sites and replot for "Sensible-heat flux, watts per square meter"

?


Create presentation-quality graph.  


Net radiation (net solar + net long wave radiation), watts per square meter


Graph of DAILY Net radiation (net solar + net long wave radiation), watts per square meter

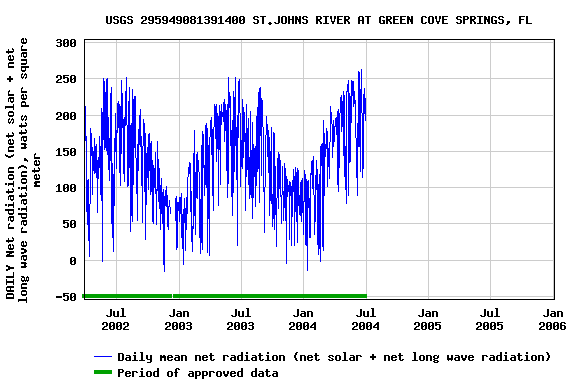
Add up to 2 more sites and replot for "Net radiation (net solar + net long wave radiation), watts per square meter"

?


Create presentation-quality graph.