PROVISIONAL DATA SUBJECT TO REVISION
Click to hidestation-specific text
Funding for this site is provided by:
 Site Information
LOCATION.--Lat 40°54'18.4", long
73°35'35.5" referenced to North American Datum of
1983, Nassau County, NY, Hydrologic Unit 02030201, at Sheep
Lane bridge, in Lattingtown.
PERIOD OF RECORD.--December 2007 to current year.
GAGE.--Water-stage recorder. Datum of gage is NGVD of 1929.
REMARKS.--Satellite telemeter for elevation at station. Gaps in record caused by equipment malfunctions are filled with estimated data from nearby gage 01302600 West Pond at Glen Cove NY and 01304057 Flax Pond at Old Field NY.
EXTREMES FOR PERIOD OF RECORD.--Maximum elevation, 11.12 ft, Oct. 29, 2012; minimum elevation, -0.99 ft, Nov. 15, 2018.
EXTREMES OUTSIDE PERIOD OF RECORD.--Storm tide of Dec. 11, 1992, reached an elevation of 11.9 ft, from high-water mark at site 0.78 mi north-northeast.
PERIOD OF RECORD1.--December 2007 to current year. Sampling depth records for December 2007 to current year are unpublished and available in files of the Geological Survey.
PERIOD OF DAILY RECORD1.-- WATER TEMPERATURE: December 2007 to current year.
SALINITY: December 2007 to current year.
INSTRUMENTATION1.--Water-quality monitor provides 6-minute-interval readings collected from 0.5 ft above bottom. Salinity record computed from specific-conductance readings.
REMARKS1.--Satellite telemeter for water temperature, specific conductance, and sampling depth parameters at station. Station discontinued from October 1, 2011, to Sept. 30, 2012.
EXTREMES FOR PERIOD OF RECORD1.--
1 Water-Quality Records
PERIOD OF RECORD.--December 2007 to current year.
GAGE.--Water-stage recorder. Datum of gage is NGVD of 1929.
REMARKS.--Satellite telemeter for elevation at station. Gaps in record caused by equipment malfunctions are filled with estimated data from nearby gage 01302600 West Pond at Glen Cove NY and 01304057 Flax Pond at Old Field NY.
EXTREMES FOR PERIOD OF RECORD.--Maximum elevation, 11.12 ft, Oct. 29, 2012; minimum elevation, -0.99 ft, Nov. 15, 2018.
EXTREMES OUTSIDE PERIOD OF RECORD.--Storm tide of Dec. 11, 1992, reached an elevation of 11.9 ft, from high-water mark at site 0.78 mi north-northeast.
PERIOD OF RECORD1.--December 2007 to current year. Sampling depth records for December 2007 to current year are unpublished and available in files of the Geological Survey.
PERIOD OF DAILY RECORD1.-- WATER TEMPERATURE: December 2007 to current year.
SALINITY: December 2007 to current year.
INSTRUMENTATION1.--Water-quality monitor provides 6-minute-interval readings collected from 0.5 ft above bottom. Salinity record computed from specific-conductance readings.
REMARKS1.--Satellite telemeter for water temperature, specific conductance, and sampling depth parameters at station. Station discontinued from October 1, 2011, to Sept. 30, 2012.
EXTREMES FOR PERIOD OF RECORD1.--
WATER TEMPERATURE: Maximum, 34.4 °C, July 18, 2013; minimum, -1.7 °C, on many days.
SALINITY: Maximum, 32.6 psu, Jan. 2, 2018; minimum, 4.1 psu, July 1, 2015.
1 Water-Quality Records
 WaterAlert – get an
email or text (SMS) alert based on your chosen threshold.
WaterAlert – get an
email or text (SMS) alert based on your chosen threshold.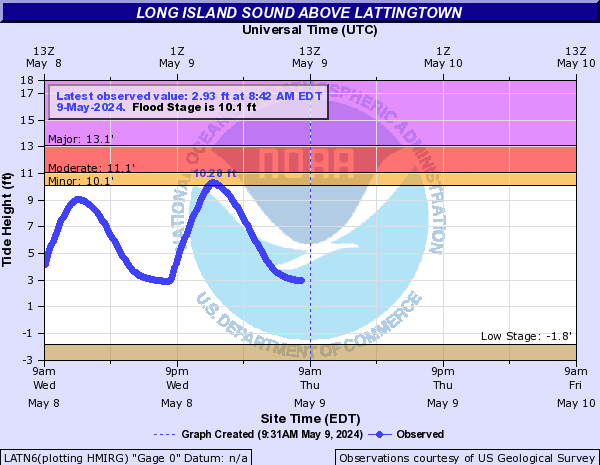 Additional Site
Information
Additional Site
Information
Peak Flow and Stage Information
NAVD 1988 Datum Conversion Information
|
Elevation observations and tidal predictions for this station are reported to NGVD 1929. To convert data to NAVD 1988 subtract 1.08 ft. To convert data to MHHW datum subtract 4.83 ft. These corrections vary from site to site. |
|
NGVD
1929 is the National Geodetic Vertical Datum of 1929,
formerly called "mean sea level" or "Sea
Level Datum of 1929." NGVD 1929 was a general
adjustment of the first-order level nets fit to mean sea
level at 26 tide gages in the US and Canada.
NAVD 1988 is the North American Vertical Datum of 1988, which is a geodetic datum derived from a general adjustment of the first-order level nets fit to 1 tide gage in eastern Canada. MHHW is mean higher high water, which is a site-specific datum determined by averaging the highest of the 2 high tides that occur each day over a 19-year tidal epoch. For tide gages with less than 19 years of record, this datum is estimated by correlation with long-term tide gages. |
Additional sensor graph(s) available (click on graph or sensor name)

Water elevation, astronomical-tide elevation, and residual water level Graph updated every 15 minutes
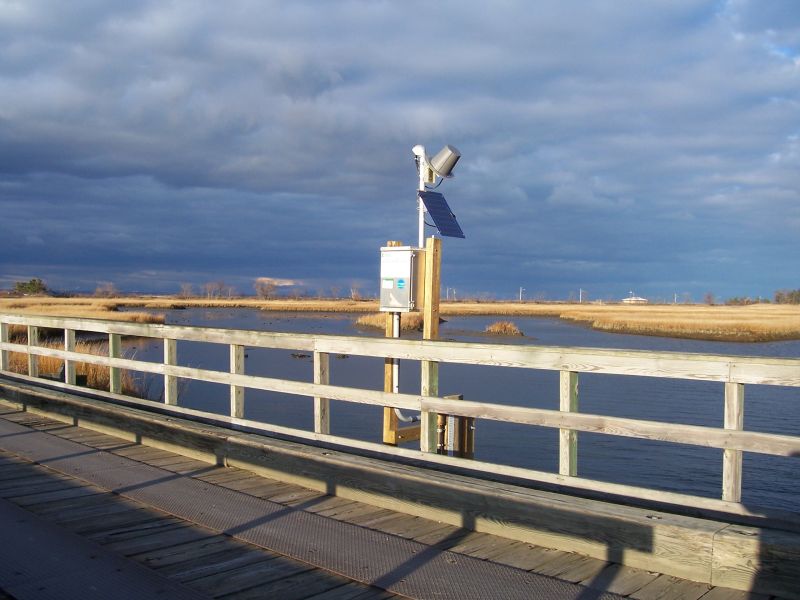 Station image
Summary of all available data for this site
Instantaneous-data availability statement


