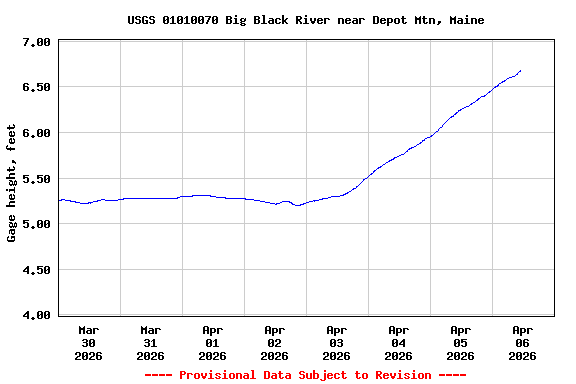
Most recent instantaneous value: Ice 04-06-2026 10:00 EDT
See this graph on the Monitoring Location Pages
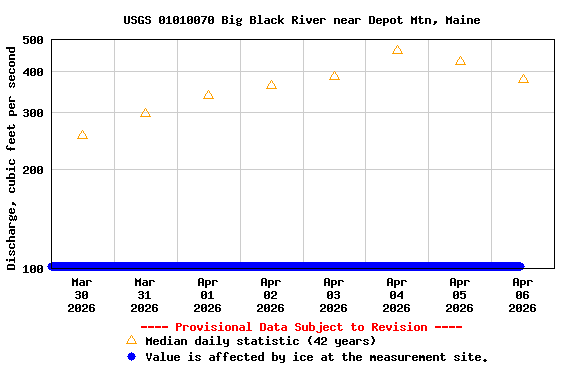
| Most Recent Instantaneous Value Apr 6 | Min (1993) | 25th percen- tile | Median | Mean | 75th percen- tile | Max (2010) |
|---|---|---|---|---|---|---|
| -- unavailable -- | 51.0 | 198 | 378 | 777 | 1410 | 3540 |