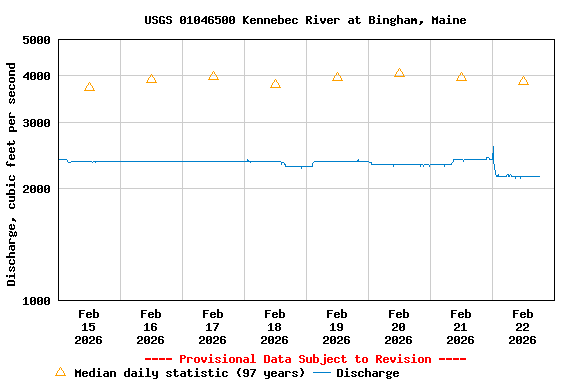
USGS 01046500 Kennebec River at Bingham, Maine

PROVISIONAL DATA SUBJECT TO REVISION

Click to hidestation-specific text
Station operated in cooperation with Brookfield Renewable.
Gage is operated in conjunction with a co-located precipitation gage (station 450306069531101).

Period of Record - Discharge: June 1907 to June 1910, October 1930 to current year. Monthly discharge only for some periods prior to June 1910 published in WSP 1301.

Current shift-adjusted rating in tab-delimited format.
These are updated daily and can change often! If you use these ratings it is important that you update often so that you have the most current version.
What is a shift-adjusted rating?
This station managed by the Augusta ME Field Office.

Available Parameters Available Period
  
2023-12-26  2024-04-25
2023-12-26  2024-04-25
1990-10-01  2024-04-25
2007-10-01  2024-04-25


 (7)
 

  -- or --


Summary of all available data for this site
Instantaneous-data availability statement


Temperature, air, degrees Celsius

Most recent instantaneous value: -2.2 04-25-2024   01:15 EDT
Graph of

Add up to 2 more sites and replot for "Temperature, air, degrees Celsius"

?


Create presentation-quality / stand-alone graph.   Subscribe to WaterAlert      

See this graph on the Monitoring Location Pages


Temperature, air, degrees Fahrenheit

Most recent instantaneous value: 28.0 04-25-2024   01:15 EDT
Graph of

Add up to 2 more sites and replot for "Temperature, air, degrees Fahrenheit"

?


Create presentation-quality / stand-alone graph.   Subscribe to WaterAlert      

See this graph on the Monitoring Location Pages


Discharge, cubic feet per second

Most recent instantaneous value: 10500 04-25-2024   01:15 EDT
Graph of

Add up to 2 more sites and replot for "Discharge, cubic feet per second"

?


Create presentation-quality / stand-alone graph.   Subscribe to WaterAlert      

See this graph on the Monitoring Location Pages


Daily discharge, cubic feet per second -- statistics for Apr 25 based on 95 water years of record more
Min
(1943)
25th
percen-
tile
Median Mean Most Recent
Instantaneous
Value Apr 25
75th
percen-
tile
Max
(1983)
1220 5180 8280 10100 10500 11900 35200


Gage height, feet

Most recent instantaneous value: 9.65 04-25-2024   01:15 EDT
Graph of

Add up to 2 more sites and replot for "Gage height, feet"

?


Create presentation-quality / stand-alone graph.   Subscribe to WaterAlert      

See this graph on the Monitoring Location Pages