PROVISIONAL DATA SUBJECT TO REVISION
Click to hidestation-specific text
Funding for this site is provided by:
 Site Information
LOCATION.--Lat 40°42'15.7", long
73°18'49.1" referenced to North American Datum of
1983, Suffolk County, NY, Hydrologic Unit 02030202, on left
bank at upstream side of bridge on John Street in Babylon, 180
ft downstream from Long Island Railroad, and 0.6 mi upstream
from mouth.
DRAINAGE AREA.--22.7 mi².
PERIOD OF RECORD.--October 1944 to current year (monthly means estimated December 1966 to November 1967).
REVISIONS HISTORY.--WSP 1141: Drainage area. WSP 1702: 1955 (M), 1956 (M). WDR NY-74-1: 1970 (P). WDR NY-83-2: 1982 (P).
GAGE.--Water-stage recorder and concrete control. Datum of gage is 6.36 ft above NGVD of 1929 and 5.16 ft above NAVD of 1988 (VERTCON). October 1944 to December 1966, water-stage recorder at site 100 ft east at datum 0.34 ft higher.
REMARKS.--Flow regulated slightly by pumping operations at railroad and occasionally by ponds above station. Indeterminate effect caused by ground-water pumpage for water-supply purposes at Smith Street substation 0.2 mi northwest of gage. Prior to November 1950, slight diurnal fluctuation caused by power operations.
Water Years 2014-22: Records fair except those for estimated daily discharges, which are poor.
EXTREMES FOR PERIOD OF RECORD.--Maximum discharge, 400 ft³/s, August 13, 2014, gage height, 4.75 ft, from floodmarks, from rating curve extended above 110 ft³/s on basis of flow-through-culvert measurement of peak flow; minimum discharge, 1.1 ft³/s, Sept. 10, 1995, result of regulation, for part or all of each day Mar. 1, July 15-23, 2002, Oct. 7, 8, 2005; minimum gage height, 0.13 ft, June 28, 1963, datum then in use.
 WaterAlert – get an
email or text (SMS) alert based on your chosen threshold.
WaterAlert – get an
email or text (SMS) alert based on your chosen threshold.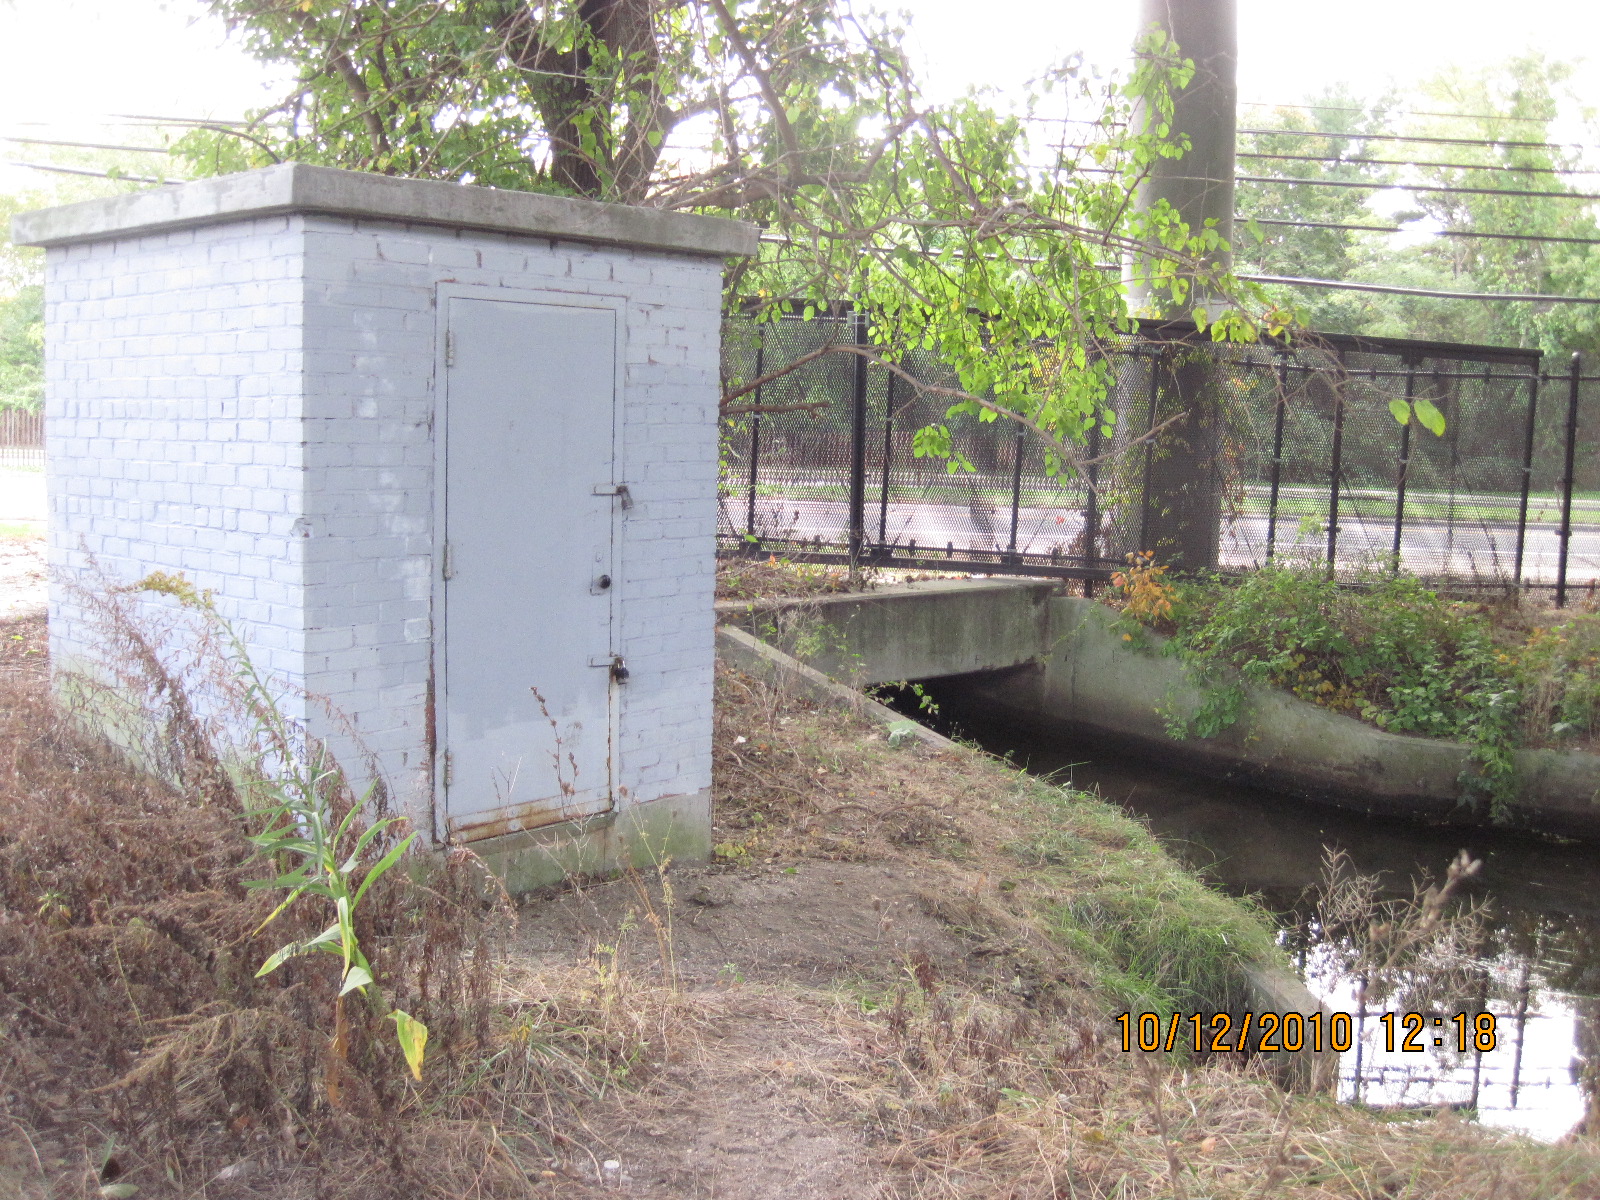 Station image
Summary of all available data for this site
Instantaneous-data availability statement
