USGS 01479820 Red Clay Creek near Kennett Square, PA

PROVISIONAL DATA SUBJECT TO REVISION

Click to hidestation-specific text


Station gage imageSTATION.--01479820 RED CLAY CREEK NEAR KENNETT SQUARE, PA
LOCATION.--Lat 39`49'00", long 75`41'31", Chester County, Hydrologic Unit 02040205, on left bank along SR 82 (Creek Road), and 3.0 mi south of the intersection of SR 82 and U.S. Highway 1 at Kennett Square.
DRAINAGE AREA.--28.3 square miles.
PERIOD OF RECORD.--January 1988 to current year.
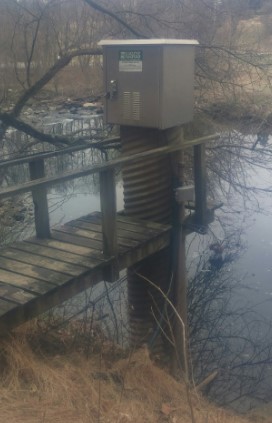
GAGE.--Water-stage recorder, crest-stage gage, and water-quality monitor. Elevation of gage is 196.02 ft above National Geodetic Vertical Datum of 1929, from survey.
GAGE HEIGHTS OF IMPORTANCE.-
COOPERATION.--Station established and maintained by the U.S. Geological Survey. Funding for the operation of this station is provided by the Pennsylvania Department of Environmental Protection, Delaware Geological Survey, and the U.S. Geological Survey.
GAGE HEIGHTS OF IMPORTANCE.-
Supplied by NWS: Action stage-6.5 ft.
This station managed by the PAWSC Downingtown Field Office.

Available Parameters Available Period
  
1990-10-01  2024-03-28
2007-10-01  2024-03-28
2015-12-17  2024-03-28
2015-12-17  2024-03-28
2015-12-17  2024-03-28


 (7)
 

  -- or --


Summary of all available data for this site
Instantaneous-data availability statement


Discharge, cubic feet per second

Most recent instantaneous value: 69.6 03-28-2024   09:45 EDT
Graph of  Discharge, cubic feet per second

Add up to 2 more sites and replot for "Discharge, cubic feet per second"

?


Create presentation-quality / stand-alone graph.   Subscribe to WaterAlert      

See this graph on the Monitoring Location Pages


Daily discharge, cubic feet per second -- statistics for Mar 28 based on 35 water years of record more
Min
(2002)
25th
percen-
tile
Median 75th
percen-
tile
Most Recent
Instantaneous
Value Mar 28
Mean Max
(2005)
25.1 33 43 61 69.6 72 663


Gage height, feet

Most recent instantaneous value: 3.55 03-28-2024   09:45 EDT
Graph of  Gage height, feet

Add up to 2 more sites and replot for "Gage height, feet"

?


Create presentation-quality / stand-alone graph.   Subscribe to WaterAlert      

See this graph on the Monitoring Location Pages


Turbidity, water, unfiltered, monochrome near infra-red LED light, 780-900 nm, detection angle 90 +-2.5 degrees, formazin nephelometric units (FNU)

Most recent instantaneous value: 7.1 03-28-2024   09:45 EDT
Graph of  Turbidity, water, unfiltered, monochrome near infra-red LED light, 780-900 nm, detection angle 90 +-2.5 degrees, formazin nephelometric units (FNU)

Add up to 2 more sites and replot for "Turbidity, water, unfiltered, monochrome near infra-red LED light, 780-900 nm, detection angle 90 +-2.5 degrees, formazin nephelometric units (FNU)"

?


Create presentation-quality / stand-alone graph.   Subscribe to WaterAlert      

See this graph on the Monitoring Location Pages


Suspended sediment load, water, unfiltered, computed, the product of regression-computed suspended sediment concentration and streamflow, short tons per day

Most recent instantaneous value: 1.54 03-28-2024   09:45 EDT
Graph of  Suspended sediment load, water, unfiltered, computed, the product of regression-computed suspended sediment concentration and streamflow, short tons per day

Add up to 2 more sites and replot for "Suspended sediment load, water, unfiltered, computed, the product of regression-computed suspended sediment concentration and streamflow, short tons per day"

?


Create presentation-quality / stand-alone graph.   Subscribe to WaterAlert      

See this graph on the Monitoring Location Pages


Suspended sediment concentration, water, unfiltered, estimated by regression equation, milligrams per liter

Most recent instantaneous value: 8.2 03-28-2024   09:45 EDT
Graph of  Suspended sediment concentration, water, unfiltered, estimated by regression equation, milligrams per liter

Add up to 2 more sites and replot for "Suspended sediment concentration, water, unfiltered, estimated by regression equation, milligrams per liter"

?


Create presentation-quality / stand-alone graph.   Subscribe to WaterAlert      

See this graph on the Monitoring Location Pages