USGS 01651827 ANACOSTIA RIVER NR BUZZARD POINT AT WASHINGTON, DC

PROVISIONAL DATA SUBJECT TO REVISION

Click to hidestation-specific text
Click for larger image LOCATION.--Lat 38°51'54.6", long 77°00'37.2", District of Columbia, Hydrologic Unit 02070010, on right bank, 0.5 mi upstream from mouth.
PERIOD OF RECORD.--March 2019 to current year.
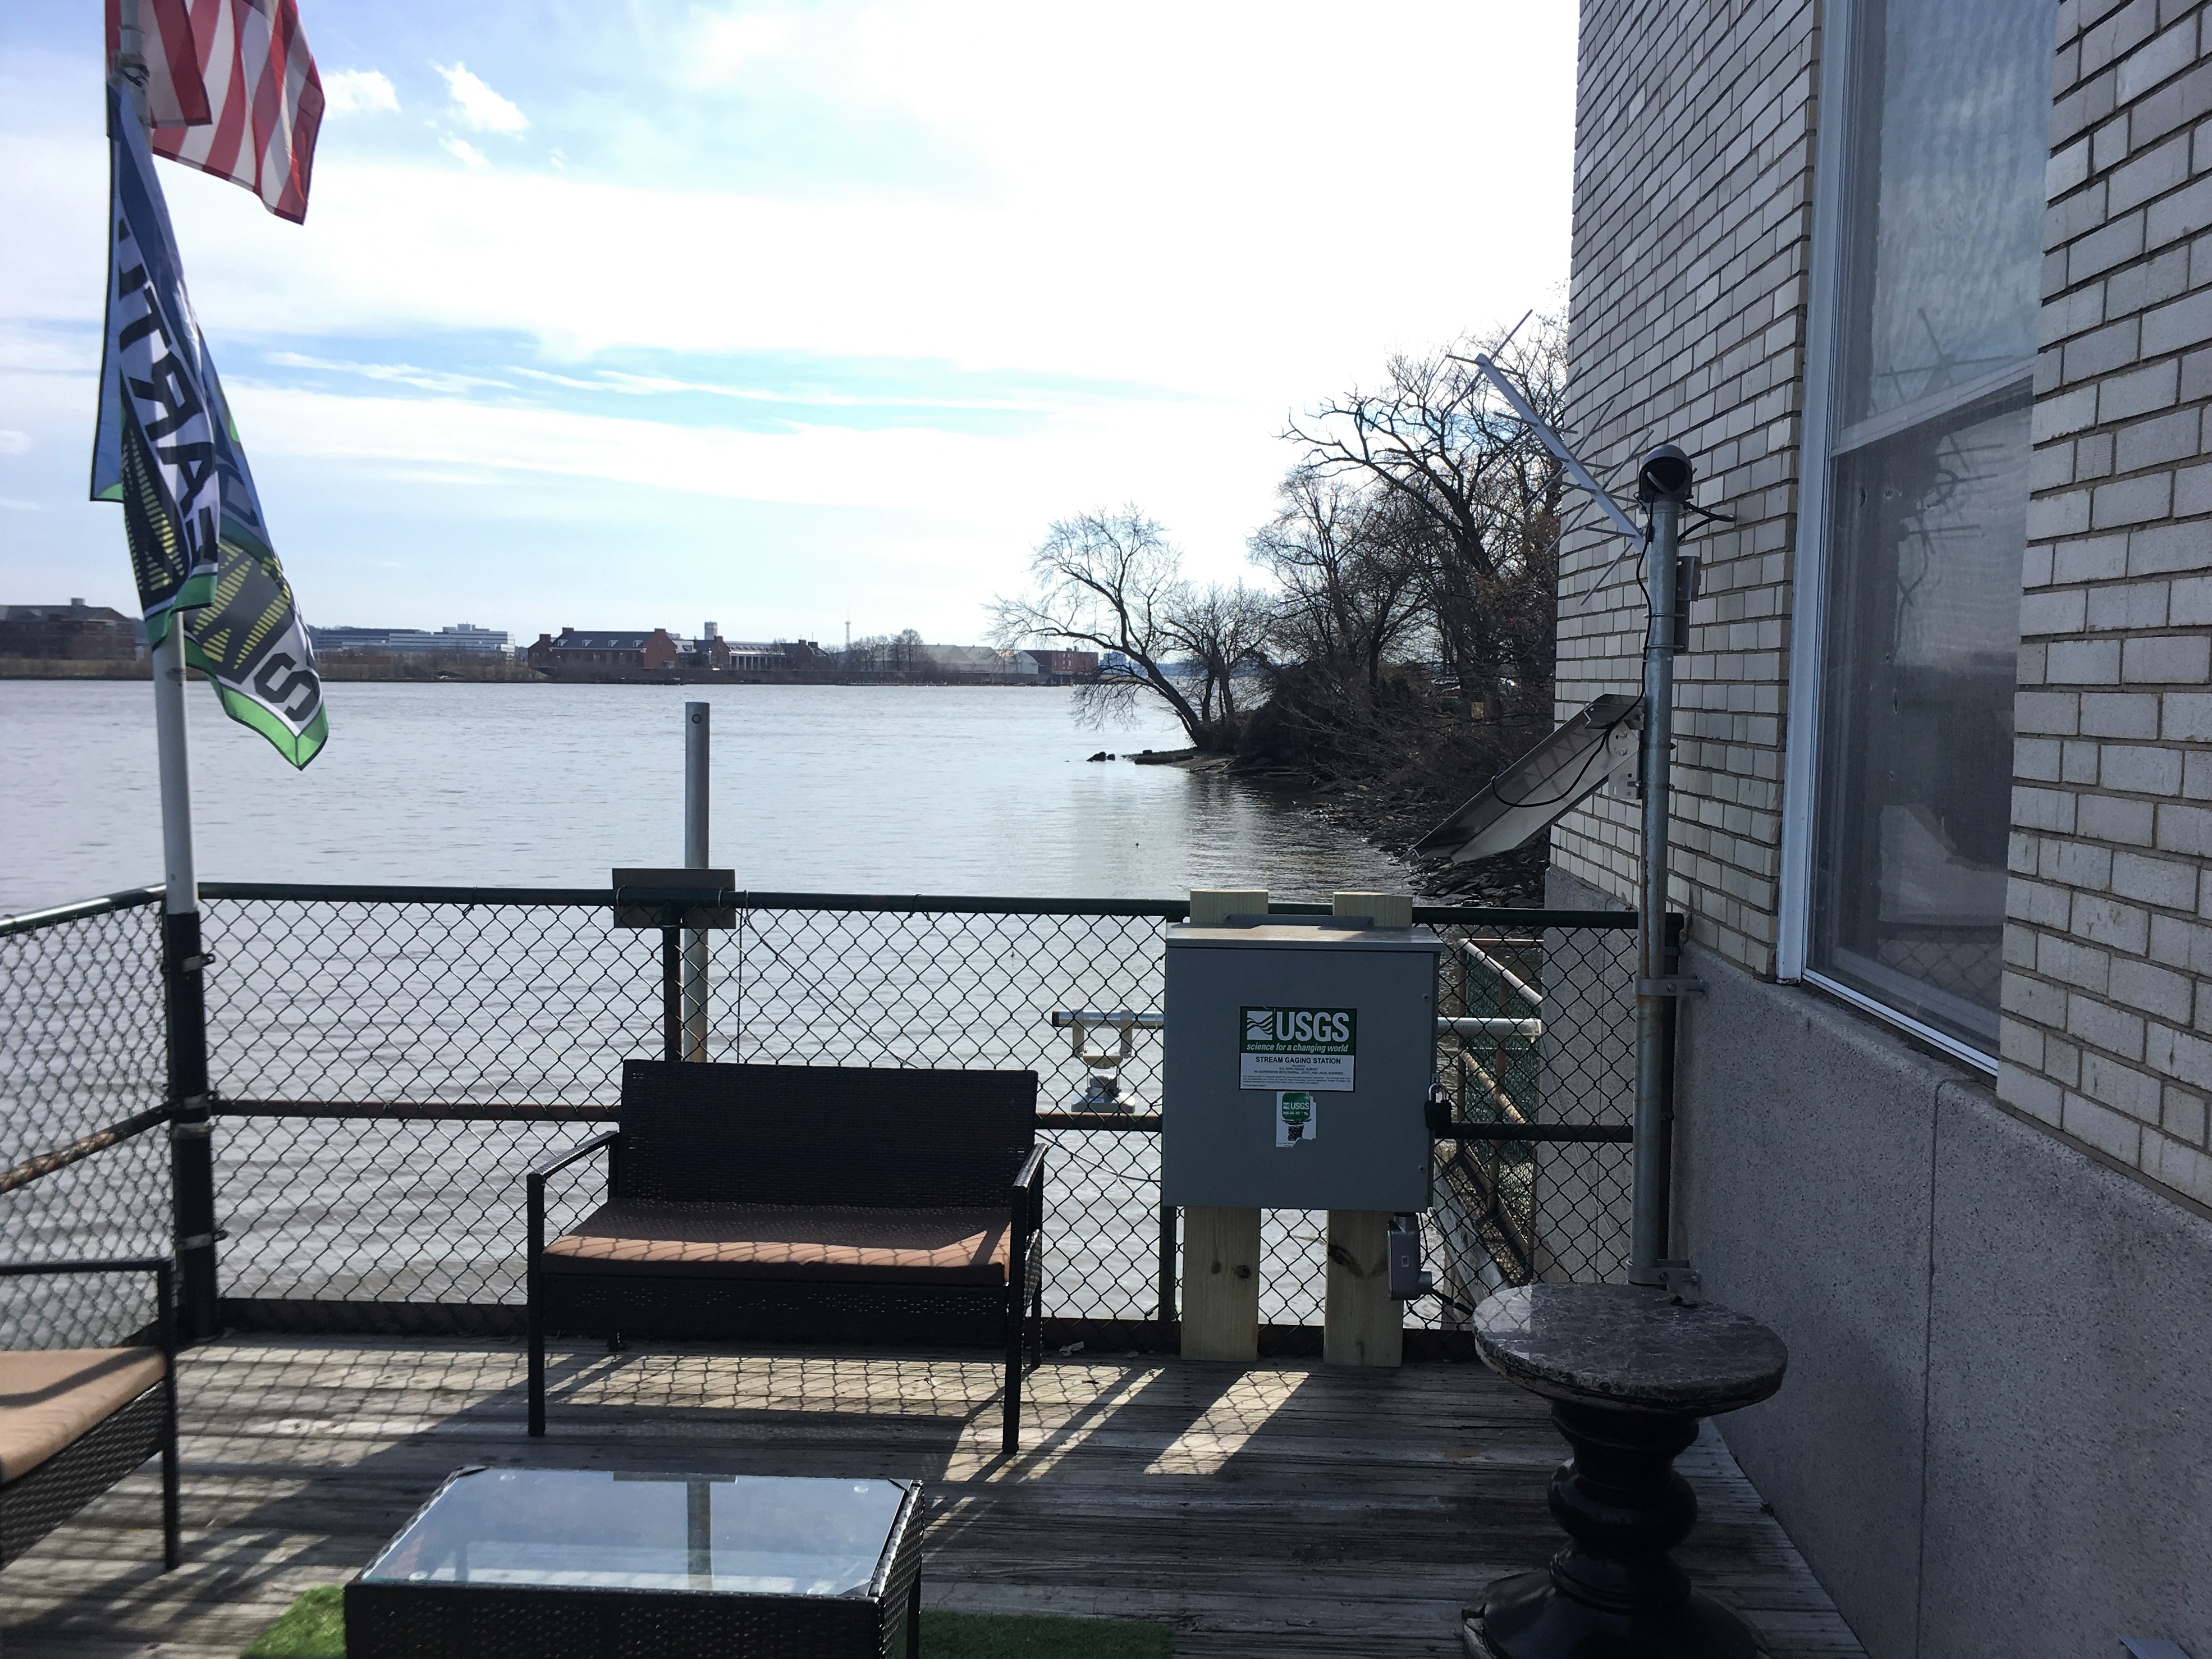
GAGE.--Water-stage recorder, velocity meter, and water-quality monitor. Datum of gage is 0.00 ft above North American Vertical Datum of 1988.
REMARKS.--This is a tidal station. U.S. Geological Survey satellite data-collection platform at station.
COOPERATION.--Funding for the operation of this station is provided by the Washington D.C. Department of Energy & Environment, the Federal
Urban Waters Partnership, and the U.S. Geological Survey.

Boating safety tips
This station managed by the MD-DE-DC Water Science Center Baltimore office.

Available Parameters Available Period
  
2019-03-11  2024-04-16
2021-11-08  2024-04-16
2019-03-13  2024-04-16
2019-03-11  2024-04-16
2021-04-16  2024-04-16
2019-03-11  2024-04-16
2021-11-10  2024-04-14


 (7)
 

  -- or --


Summary of all available data for this site
Instantaneous-data availability statement


Temperature, water, degrees Celsius, [(2)]

Most recent instantaneous value: 17.1 04-16-2024   10:00 EDT
Graph of  Temperature, water, degrees Celsius, [(2)]

Add up to 2 more sites and replot for "Temperature, water, degrees Celsius, [(2)]"

?


Create presentation-quality / stand-alone graph.   Subscribe to WaterAlert      

See this graph on the Monitoring Location Pages


Discharge, cubic feet per second

Most recent instantaneous value: 1330 04-16-2024   10:00 EDT
Graph of  Discharge, cubic feet per second

Add up to 2 more sites and replot for "Discharge, cubic feet per second"

?


Create presentation-quality / stand-alone graph.   Subscribe to WaterAlert      

See this graph on the Monitoring Location Pages


Gage height, feet

Most recent instantaneous value: -0.11 04-16-2024   10:00 EDT
Graph of  Gage height, feet

Add up to 2 more sites and replot for "Gage height, feet"

?


Create presentation-quality / stand-alone graph.   Subscribe to WaterAlert      

See this graph on the Monitoring Location Pages


Specific conductance, water, unfiltered, microsiemens per centimeter at 25 degrees Celsius

Most recent instantaneous value: 309 04-16-2024   10:00 EDT
Graph of  Specific conductance, water, unfiltered, microsiemens per centimeter at 25 degrees Celsius

Add up to 2 more sites and replot for "Specific conductance, water, unfiltered, microsiemens per centimeter at 25 degrees Celsius"

?


Create presentation-quality / stand-alone graph.   Subscribe to WaterAlert      

See this graph on the Monitoring Location Pages


Stream water level elevation above NAVD 1988, in feet

Most recent instantaneous value: -0.25 04-16-2024   10:00 EDT
Graph of  Stream water level elevation above NAVD 1988, in feet

Add up to 2 more sites and replot for "Stream water level elevation above NAVD 1988, in feet"

?


Create presentation-quality / stand-alone graph.   Subscribe to WaterAlert      

See this graph on the Monitoring Location Pages


Turbidity, water, unfiltered, monochrome near infra-red LED light, 780-900 nm, detection angle 90 +-2.5 degrees, formazin nephelometric units (FNU)

Most recent instantaneous value: 7.8 04-16-2024   10:00 EDT
Graph of  Turbidity, water, unfiltered, monochrome near infra-red LED light, 780-900 nm, detection angle 90 +-2.5 degrees, formazin nephelometric units (FNU)

Add up to 2 more sites and replot for "Turbidity, water, unfiltered, monochrome near infra-red LED light, 780-900 nm, detection angle 90 +-2.5 degrees, formazin nephelometric units (FNU)"

?


Create presentation-quality / stand-alone graph.   Subscribe to WaterAlert      

See this graph on the Monitoring Location Pages


Discharge, tidally filtered, cubic feet per second

Most recent instantaneous value: -602 04-14-2024   22:45 EDT
Graph of  Discharge, tidally filtered, cubic feet per second

Add up to 2 more sites and replot for "Discharge, tidally filtered, cubic feet per second"

?


Create presentation-quality / stand-alone graph.   Subscribe to WaterAlert      

See this graph on the Monitoring Location Pages