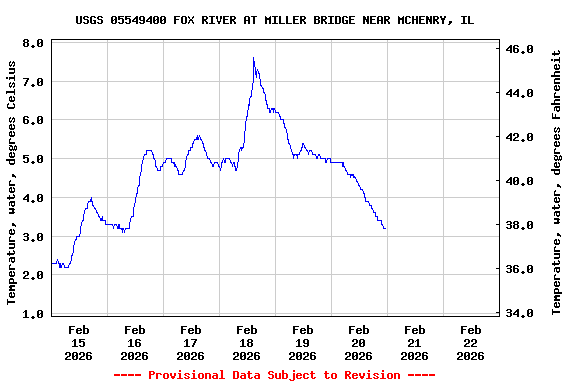
Most recent instantaneous value: 3.2 02-20-2026 23:00 CST
See this graph on the Monitoring Location Pages
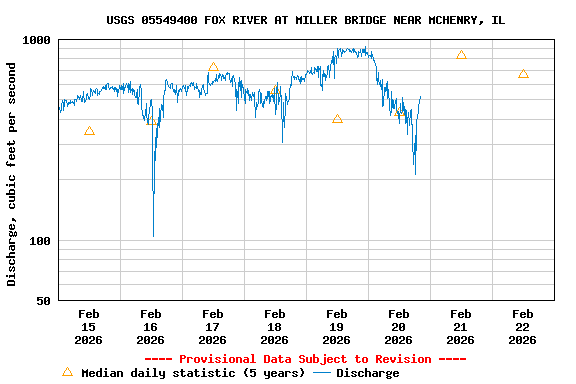
| Min (2021) | 25th percen- tile | Most Recent Instantaneous Value Feb 22 | Median | Mean | 75th percen- tile | Max (2023) |
|---|---|---|---|---|---|---|
| 129 | 233 | 518 | 668 | 771 | 1360 | 1590 |
![Graph of Gage height, feet, [Radar]](https://natwebcaww01.wr.usgs.gov/nwisweb/data/img/USGS.05549400.276002.00065..20260215.20260222..0..gif)
![Graph of Water velocity reading from field sensor, feet per second, [AVG VEL-X]](https://natwebcaww01.wr.usgs.gov/nwisweb/data/img/USGS.05549400.276038.72254..20260215.20260222..0..gif)

![]() U.S. Department of the Interior |
U.S. Geological Survey
U.S. Department of the Interior |
U.S. Geological Survey
Title: USGS Surface-Water Historical Instantaneous Data for the Nation
URL:
Page Contact Information: Illinois Water Data Support Team
Page Last Modified: 2026-02-22 21:30:31 EST
2.41 1.75 caww01