Most recent instantaneous value: Ice 02-24-2026 14:00 MST
See this graph on the Monitoring Location Pages
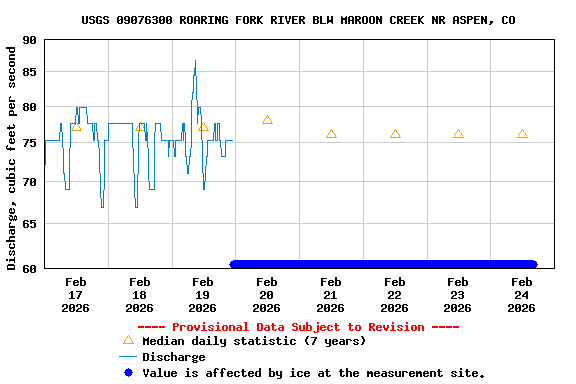
| Most Recent Instantaneous Value Feb 24 | Min (2023) | 25th percen- tile | Median | Mean | 75th percen- tile | Max (2020) |
|---|---|---|---|---|---|---|
| -- unavailable -- | 70.6 | 71 | 76 | 79 | 84 | 98.5 |