USGS 01115183 QUONOPAUG BK AT RT 116 NR NORTH SCITUATE, RI

PROVISIONAL DATA SUBJECT TO REVISION

Click to hidestation-specific text

LOCATION.--Lat 41o47'51", long 71o35'07", Providence County, RI, Hydrologic Unit 01090004, on left bank, 200 ft downstream from bridge on Elmdale Road, 2.4 mi south of North Scituate.

DRAINAGE AREA--—1.96 mi2.

WATER-DISCHARGE RECORDS

PERIOD OF RECORD.—February 2009 to current year. Discharge measurements made in water years 1993-06, 2009 to current year.

GAGE.--Data Collection Platform with telephone telemeter. Datum of gage is 359.19 ft above NAVD 1988, estimated from topographic map.

WATER-QUALITY RECORDS

PERIOD OF RECORD.—January 2000 to May 2001; October 2001 to September 2006; and June 2009 to current year. Intermittent measurements made in October 2008 to current year.
INSTRUMENTATION.--Water temperature and specific conductance monitor.

COOPERATION BY.--Providence Water Supply Board
 

Available Parameters Available Period
  
2009-02-08  2025-10-18
2009-02-06  2025-10-18
2009-02-06  2025-10-18
2009-06-21  2025-10-18


 (7)
 

  -- or --


Summary of all available data for this site
Instantaneous-data availability statement

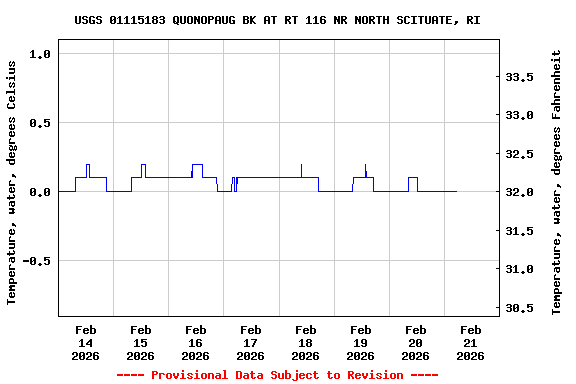
Temperature, water, degrees Celsius
 
-- Data temporarily unavailable for the time period specified --


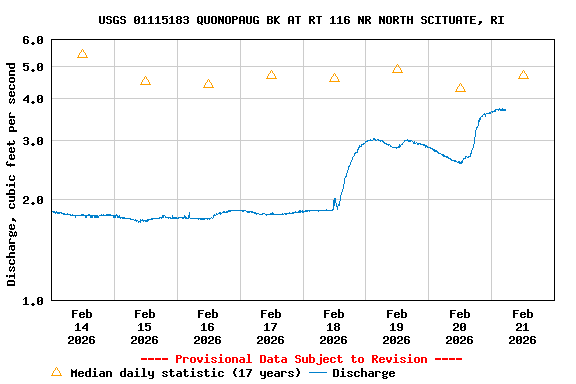
Discharge, cubic feet per second

Most recent instantaneous value: 1.32 10-18-2025   12:20 EDT
Graph of  Discharge, cubic feet per second

Add up to 2 more sites and replot for "Discharge, cubic feet per second"

?


Create presentation-quality / stand-alone graph.   Subscribe to WaterAlert      

See this graph on the Monitoring Location Pages


Daily discharge, cubic feet per second -- statistics for Oct 18 based on 17 water years of record more
Min
(2016)
25th
percen-
tile
Most Recent
Instantaneous
Value Oct 18
Median Mean 75th
percen-
tile
Max
(2020)
0.05 0.4 1.32 1.4 2.2 3.5 10.4


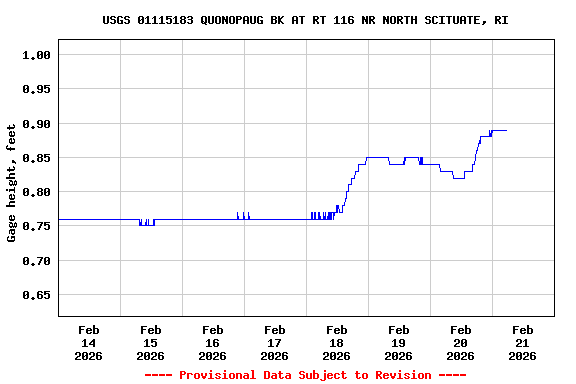
Gage height, feet

Most recent instantaneous value: 0.68 10-18-2025   12:20 EDT
Graph of  Gage height, feet

Add up to 2 more sites and replot for "Gage height, feet"

?


Create presentation-quality / stand-alone graph.   Subscribe to WaterAlert      

See this graph on the Monitoring Location Pages


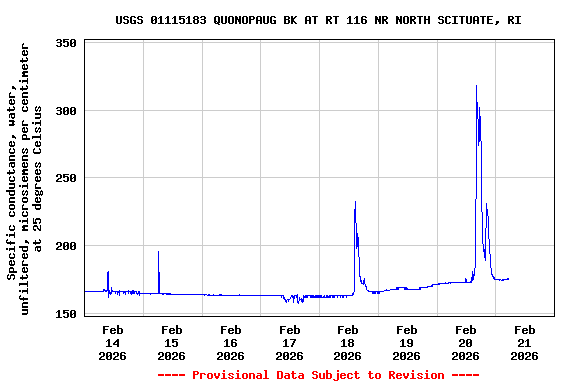
Specific conductance, water, unfiltered, microsiemens per centimeter at 25 degrees Celsius

Most recent instantaneous value: 158 10-18-2025   12:20 EDT
Graph of  Specific conductance, water, unfiltered, microsiemens per centimeter at 25 degrees Celsius

Add up to 2 more sites and replot for "Specific conductance, water, unfiltered, microsiemens per centimeter at 25 degrees Celsius"

?


Create presentation-quality / stand-alone graph.   Subscribe to WaterAlert      

See this graph on the Monitoring Location Pages