Most recent instantaneous value: 12.5 10-06-2024 06:15 EDT
See this graph on the Monitoring Location Pages
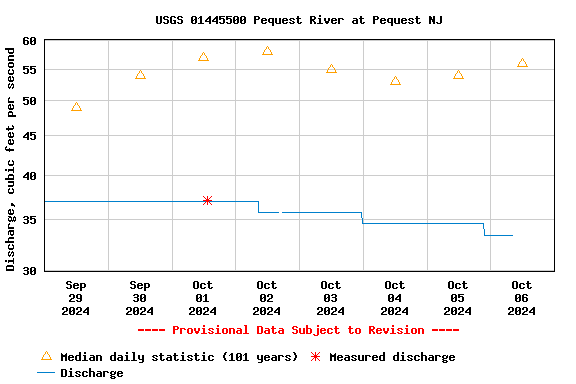
| Min (1966) | Most Recent Instantaneous Value Oct 6 | 25th percen- tile | Median | Mean | 75th percen- tile | Max (2012) |
|---|---|---|---|---|---|---|
| 16.0 | 33.4 | 36 | 56 | 92 | 106 | 670 |

![]() U.S. Department of the Interior |
U.S. Geological Survey
U.S. Department of the Interior |
U.S. Geological Survey
Title: USGS Current Conditions for the Nation
URL:
Page Contact Information: New Jersey Water Data Support Team
Page Last Modified: 2024-10-06 07:14:01 EDT
4.52 3.97 sdww02