PROVISIONAL DATA SUBJECT TO REVISION
Click to hidestation-specific text
Funding for this site is provided by:
 STATION.--01447500 LEHIGH RIVER AT STODDARTSVILLE,
PA
STATION.--01447500 LEHIGH RIVER AT STODDARTSVILLE,
PALOCATION.--Lat 41`07'49", long 75`37'33", Monroe County, Hydrologic Unit 02040106, on left bank 75 ft upstream from bridge on State Highway 115, at Stoddartsville, 1.9 mi upstream from Tobyhanna Creek, and 4.0 mi southwest of Thornhurst.
DRAINAGE AREA.--91.7 square miles.
PERIOD OF RECORD.--October 1943 to current year.
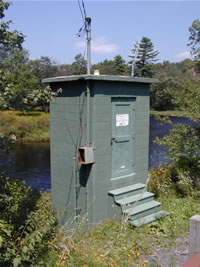
GAGE.--Water-stage recorder, crest-stage gage, water-quality monitor, and weighing-bucket precipitation gage. Datum of gage is 1,463.81 ft above National Geodetic Vertical Datum of 1929. Prior to Oct. 1, 1946, non-recording gage at site 350 ft downstream at datum 2.14 ft lower. Satellite and landline telemetry at station.
COOPERATION.--Funding for this station provided by the U.S. Army Corps of Engineers, Philadelphia District, and the Pennsylvania Department of Environmental Protection.
REMARKS.--
| The 15-minute precipitation data for this station are temporary and will only be displayed for 120 days. Time series of 1-hour or cumulative daily values will NOT be available for retrieval following the 120-day display period. Although the instrumentation is calibrated at least once a year, the temporary classification means that documented routine inspections and other quality assurance measures are not performed that would make the data acceptable for archival, retrieval, or future use in general scientific or interpretive studies. |
Summary of all available data for this site
Instantaneous-data availability statement
