USGS 01467087 Frankford Creek at Castor Ave, Philadelphia, PA

PROVISIONAL DATA SUBJECT TO REVISION

Click to hidestation-specific text


Station gage imageSTATION.--01467087 FRANKFORD CREEK AT CASTOR AVENUE,
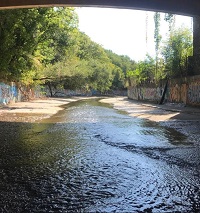
 PHILADELPHIA, PA
LOCATION.--Lat 40`00'57", long 75`05'50", Philadelphia County, Hydrologic Unit 02040202, on left bank at upstream side of Castor Avenue bridge, and 2.8 mi upstream from mouth in northeast Philadelphia.
DRAINAGE AREA.--30.4 square miles.
PERIOD OF RECORD.--July 1982 to current year.
GAGE.--Water-stage recorder, water-quality monitor and concrete control. Datum of gage is 16.56 ft above National Geodetic Vertical Datum of 1929. Satellite telemetry at station.
COOPERATION.--Station established and maintained by the U.S. Geological Survey. Funding for the operation of this station is provided by the City of Philadelphia, Water Department and the U.S. Geological Survey.
REMARKS.--Calibration of specific conductance, dissolved oxygen, and pH instrumentation is conducted exclusively by Philadelphia Water Department personnel with USGS oversight. Erroneous or missing data, resulting from instrument malfunction, are not the responsibility of USGS.
GAGE HEIGHTS OF IMPORTANCE.-
Supplied by NWS: Action stage-6 ft; Flood stage-7 ft; Moderate flood stage-8 ft; Major flood stage-10 ft.
This station managed by the PAWSC Downingtown Field Office.

Available Parameters Available Period
  
2018-10-01  2026-01-23
1990-10-19  2026-01-28
2007-10-01  2026-01-28
2018-10-01  2026-01-23
2025-09-29  2025-12-03
2025-09-29  2025-12-03
2025-09-29  2025-12-03
2023-01-28  2026-01-28
2025-09-29  2026-01-28


 (7)
 

  -- or --


Summary of all available data for this site
Instantaneous-data availability statement


Temperature, water, degrees Celsius

Most recent instantaneous value: Ssn 01-23-2026   13:15 EST
Graph of  Temperature, water, degrees Celsius

Add up to 2 more sites and replot for "Temperature, water, degrees Celsius"

?


Create presentation-quality / stand-alone graph.   Subscribe to WaterAlert      

See this graph on the Monitoring Location Pages


Discharge, cubic feet per second

Most recent instantaneous value: 11.3 01-28-2026   02:45 EST
Graph of  Discharge, cubic feet per second

Add up to 2 more sites and replot for "Discharge, cubic feet per second"

?


Create presentation-quality / stand-alone graph.   Subscribe to WaterAlert      

See this graph on the Monitoring Location Pages


Daily discharge, cubic feet per second -- statistics for Jan 28 based on 42 water years of record more
Min
(2002)
Most Recent
Instantaneous
Value Jan 28
25th
percen-
tile
Median 75th
percen-
tile
Mean Max
(2024)
6.68 11.3 12 19 26 30 202


Gage height, feet

Most recent instantaneous value: 1.55 01-28-2026   02:45 EST
Graph of  Gage height, feet

Add up to 2 more sites and replot for "Gage height, feet"

?


Create presentation-quality / stand-alone graph.   Subscribe to WaterAlert      

See this graph on the Monitoring Location Pages


Specific conductance, water, unfiltered, microsiemens per centimeter at 25 degrees Celsius

Most recent instantaneous value: Ssn 01-23-2026   13:15 EST
Graph of  Specific conductance, water, unfiltered, microsiemens per centimeter at 25 degrees Celsius

Add up to 2 more sites and replot for "Specific conductance, water, unfiltered, microsiemens per centimeter at 25 degrees Celsius"

?


Create presentation-quality / stand-alone graph.   Subscribe to WaterAlert      

See this graph on the Monitoring Location Pages


Dissolved oxygen, water, unfiltered, milligrams per liter
 
-- Data temporarily unavailable for the time period specified --

Dissolved oxygen, water, unfiltered, percent of saturation
 
-- Data temporarily unavailable for the time period specified --

pH, water, unfiltered, field, standard units
 
-- Data temporarily unavailable for the time period specified --


Barometric pressure (BP), uncorrected, pounds per square inch

Most recent instantaneous value: 14.7900 01-28-2026   02:45 EST
Graph of  Barometric pressure (BP), uncorrected, pounds per square inch

Add up to 2 more sites and replot for "Barometric pressure (BP), uncorrected, pounds per square inch"

?


Create presentation-quality / stand-alone graph.   Subscribe to WaterAlert      

See this graph on the Monitoring Location Pages


Photosynthetically active radiation (average flux density on a horizontal surface during measurement interval), micromoles of photons per square meter per second

Most recent instantaneous value: -5.0 01-28-2026   02:45 EST
Graph of  Photosynthetically active radiation (average flux density on a horizontal surface during measurement interval), micromoles of photons per square meter per second

Add up to 2 more sites and replot for "Photosynthetically active radiation (average flux density on a horizontal surface during measurement interval), micromoles of photons per square meter per second"

?


Create presentation-quality / stand-alone graph.   Subscribe to WaterAlert      

See this graph on the Monitoring Location Pages