USGS 01484272 BROADKILL RIVER NEAR MILTON, DE

PROVISIONAL DATA SUBJECT TO REVISION

Click to hidestation-specific text
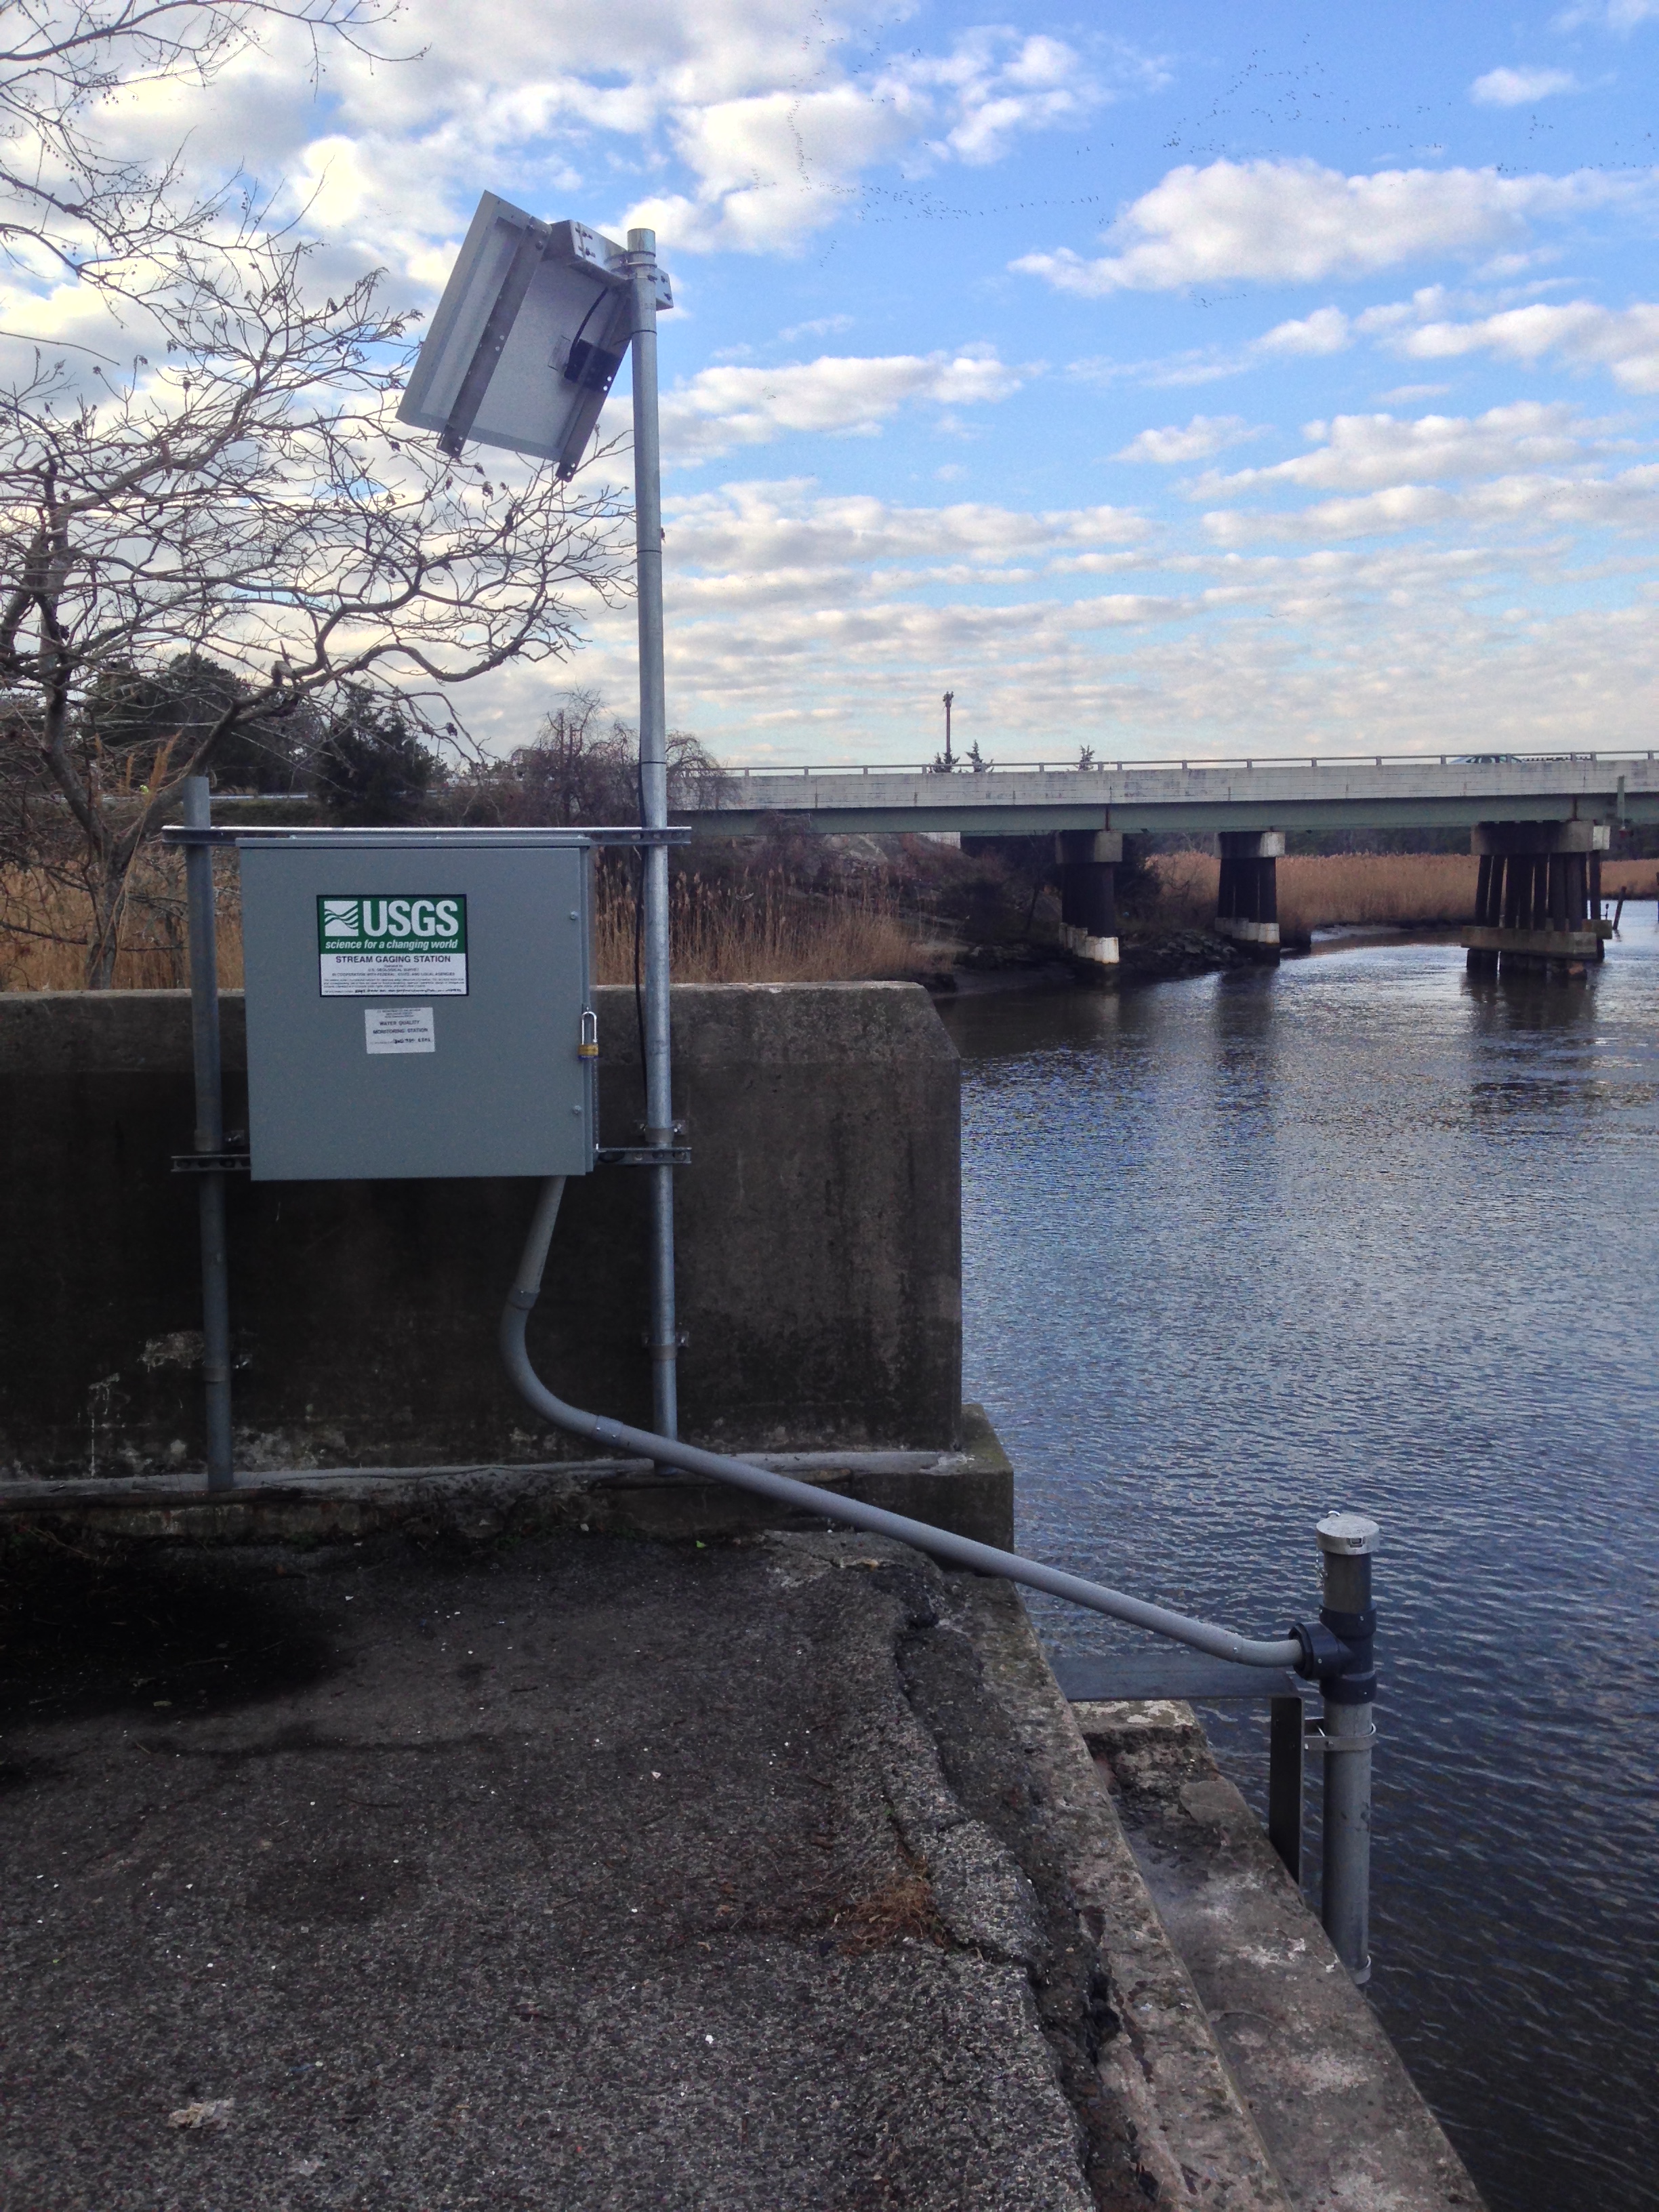
Click for larger image LOCATION.--Lat 38°47'27.6", long 75°15'02.8", Sussex County, Hydrologic Unit 02040207, on right bank at abandoned bridge abutment, just downstream of State Highway 1, 3.3 mi east of Milton, and 7.8 mi upstream of mouth.
DRAINAGE AREA.--Not determined.
PERIOD OF RECORD.--Annual maximum only, water year 2003, October 2003 to September 2005.
PERIOD OF RECORD WATER QUALITY.--December 2016 to current year.
GAGE.--Water-quality monitor.
REMARKS.--U.S. Geological Survey water-data telemeter at station.
COOPERATION.--Funding for the operation of this station is provided by the Delaware Department of Natural Resources and Environmental Control through the Delaware Geological Survey, and the U.S. Geological Survey.
This station managed by the MD-DE-DC Water Science Center Dover office.

Available Parameters Available Period
  
2016-12-21  2024-03-28
2016-12-21  2024-03-28
2016-12-21  2024-03-28
2016-12-21  2024-03-28


 (7)
 

  -- or --


Summary of all available data for this site
Instantaneous-data availability statement


Temperature, water, degrees Celsius

Most recent instantaneous value: 10.4 03-28-2024   10:45 EDT
Graph of

Add up to 2 more sites and replot for "Temperature, water, degrees Celsius"

?


Create presentation-quality / stand-alone graph.   Subscribe to WaterAlert      

See this graph on the Monitoring Location Pages


Specific conductance, water, unfiltered, microsiemens per centimeter at 25 degrees Celsius

Most recent instantaneous value: 542 03-28-2024   10:45 EDT
Graph of

Add up to 2 more sites and replot for "Specific conductance, water, unfiltered, microsiemens per centimeter at 25 degrees Celsius"

?


Create presentation-quality / stand-alone graph.   Subscribe to WaterAlert      

See this graph on the Monitoring Location Pages


Dissolved oxygen, water, unfiltered, milligrams per liter

Most recent instantaneous value: 9.4 03-28-2024   10:45 EDT
Graph of

Add up to 2 more sites and replot for "Dissolved oxygen, water, unfiltered, milligrams per liter"

?


Create presentation-quality / stand-alone graph.   Subscribe to WaterAlert      

See this graph on the Monitoring Location Pages


pH, water, unfiltered, field, standard units

Most recent instantaneous value: 6.8 03-28-2024   10:45 EDT
Graph of

Add up to 2 more sites and replot for "pH, water, unfiltered, field, standard units"

?


Create presentation-quality / stand-alone graph.   Subscribe to WaterAlert      

See this graph on the Monitoring Location Pages