PROVISIONAL DATA SUBJECT TO REVISION
Click to hidestation-specific text
The 15-minute precipitation data for this station are temporary and will only be displayed for 120 days. Although the instrumentation is calibrated at least once/year, the temporary classification means that documented routine inspections and other quality assurance measures are not performed that would make the data acceptable for archival, retrieval, or future use in general scientific or interpretive studies.
 Site Information
EXTREMES FOR PERIOD OF RECORD.--Maximum contents, 73,560 acre-ft, Apr. 5, 2005, elevation 1,005.76 ft above Mean Sea Level at Sandy Hook, NJ (1,006.06 ft above NAVD of 1988); minimum contents, 36 acre-ft, Sept. 2, 3, 4, 1953, elevation 950.4 ft above Mean Sea Level at Sandy Hook, NJ (950.7 ft above NAVD of 1988).
Funding for this site is provided by:
Site Information
-
LOCATION.--Lat 42°20'34", long 75°57'57" referenced to North American Datum of 1927, Broome County, NY, Hydrologic Unit 02050102, on left bank at control-gate structure for Whitney Point Dam on Otselic River, 0.3 mi upstream from spillway, 0.9 mi upstream from mouth, and 1.0 mi north of Whitney Point.
DRAINAGE AREA.--257 mi².
PERIOD OF RECORD.--October 1942 to September 1985 (daily mean elevations and month-end contents), October 1985 to September 2013 (month-end elevations and contents), October 2013 to current year (daily mean elevations).
REVISIONS HISTORY.--WSP 2103: Drainage area.
GAGE.--Water-stage recorder. Lake elevation record is provided in Mean Sea Level at Sandy Hook, NJ (not NGVD of 1929 as published, levels by Corps of Engineers) and NAVD of 1988 datums. To convert elevations in Mean Sea Level at Sandy Hook, NY to NAVD of 1988, add 0.30 ft. Prior to October 1970, published as "Whitney Point Reservoir at Whitney Point."
COOPERATION.--Capacity table provided by Corps of Engineers, 1942.
REMARKS.--Elevations listed herein are in ft above Mean Sea Level at Sandy Hook, NJ. Lake is formed by earthfill dam with concrete spillway, completed by Corps of Engineers in 1942 for flood control; first used for flood regulation on Mar. 9, 1942. Usable capacity 86,440 acre-ft between elevations 950.0 ft (sill of gates) and 1,010.0 ft (crest of spillway). Dead storage, 28 acre-ft. Figures given herein represent total contents. Discharge is controlled by operation of three gates. Water is stored during high flows and released when downstream conditions warrant. Lake is for flood control and recreation.
Capacity table (elevation, in feet, and total contents, in acre-feet)

Elevation Contents        Elevation Contents       Elevation Contents
   950.0       28          975.0     15,290          1,000.0     59,220
   955.0      250          980.0     22,240          1,005.0     71,440
   960.0    1,250          985.0     30,200          1,010.0     86,470
   965.0    4,260          990.0     38,980
   970.0    9,270          995.0     48,600
EXTREMES FOR PERIOD OF RECORD.--Maximum contents, 73,560 acre-ft, Apr. 5, 2005, elevation 1,005.76 ft above Mean Sea Level at Sandy Hook, NJ (1,006.06 ft above NAVD of 1988); minimum contents, 36 acre-ft, Sept. 2, 3, 4, 1953, elevation 950.4 ft above Mean Sea Level at Sandy Hook, NJ (950.7 ft above NAVD of 1988).
 WaterAlert – get an email or text (SMS) alert based on your chosen threshold.
 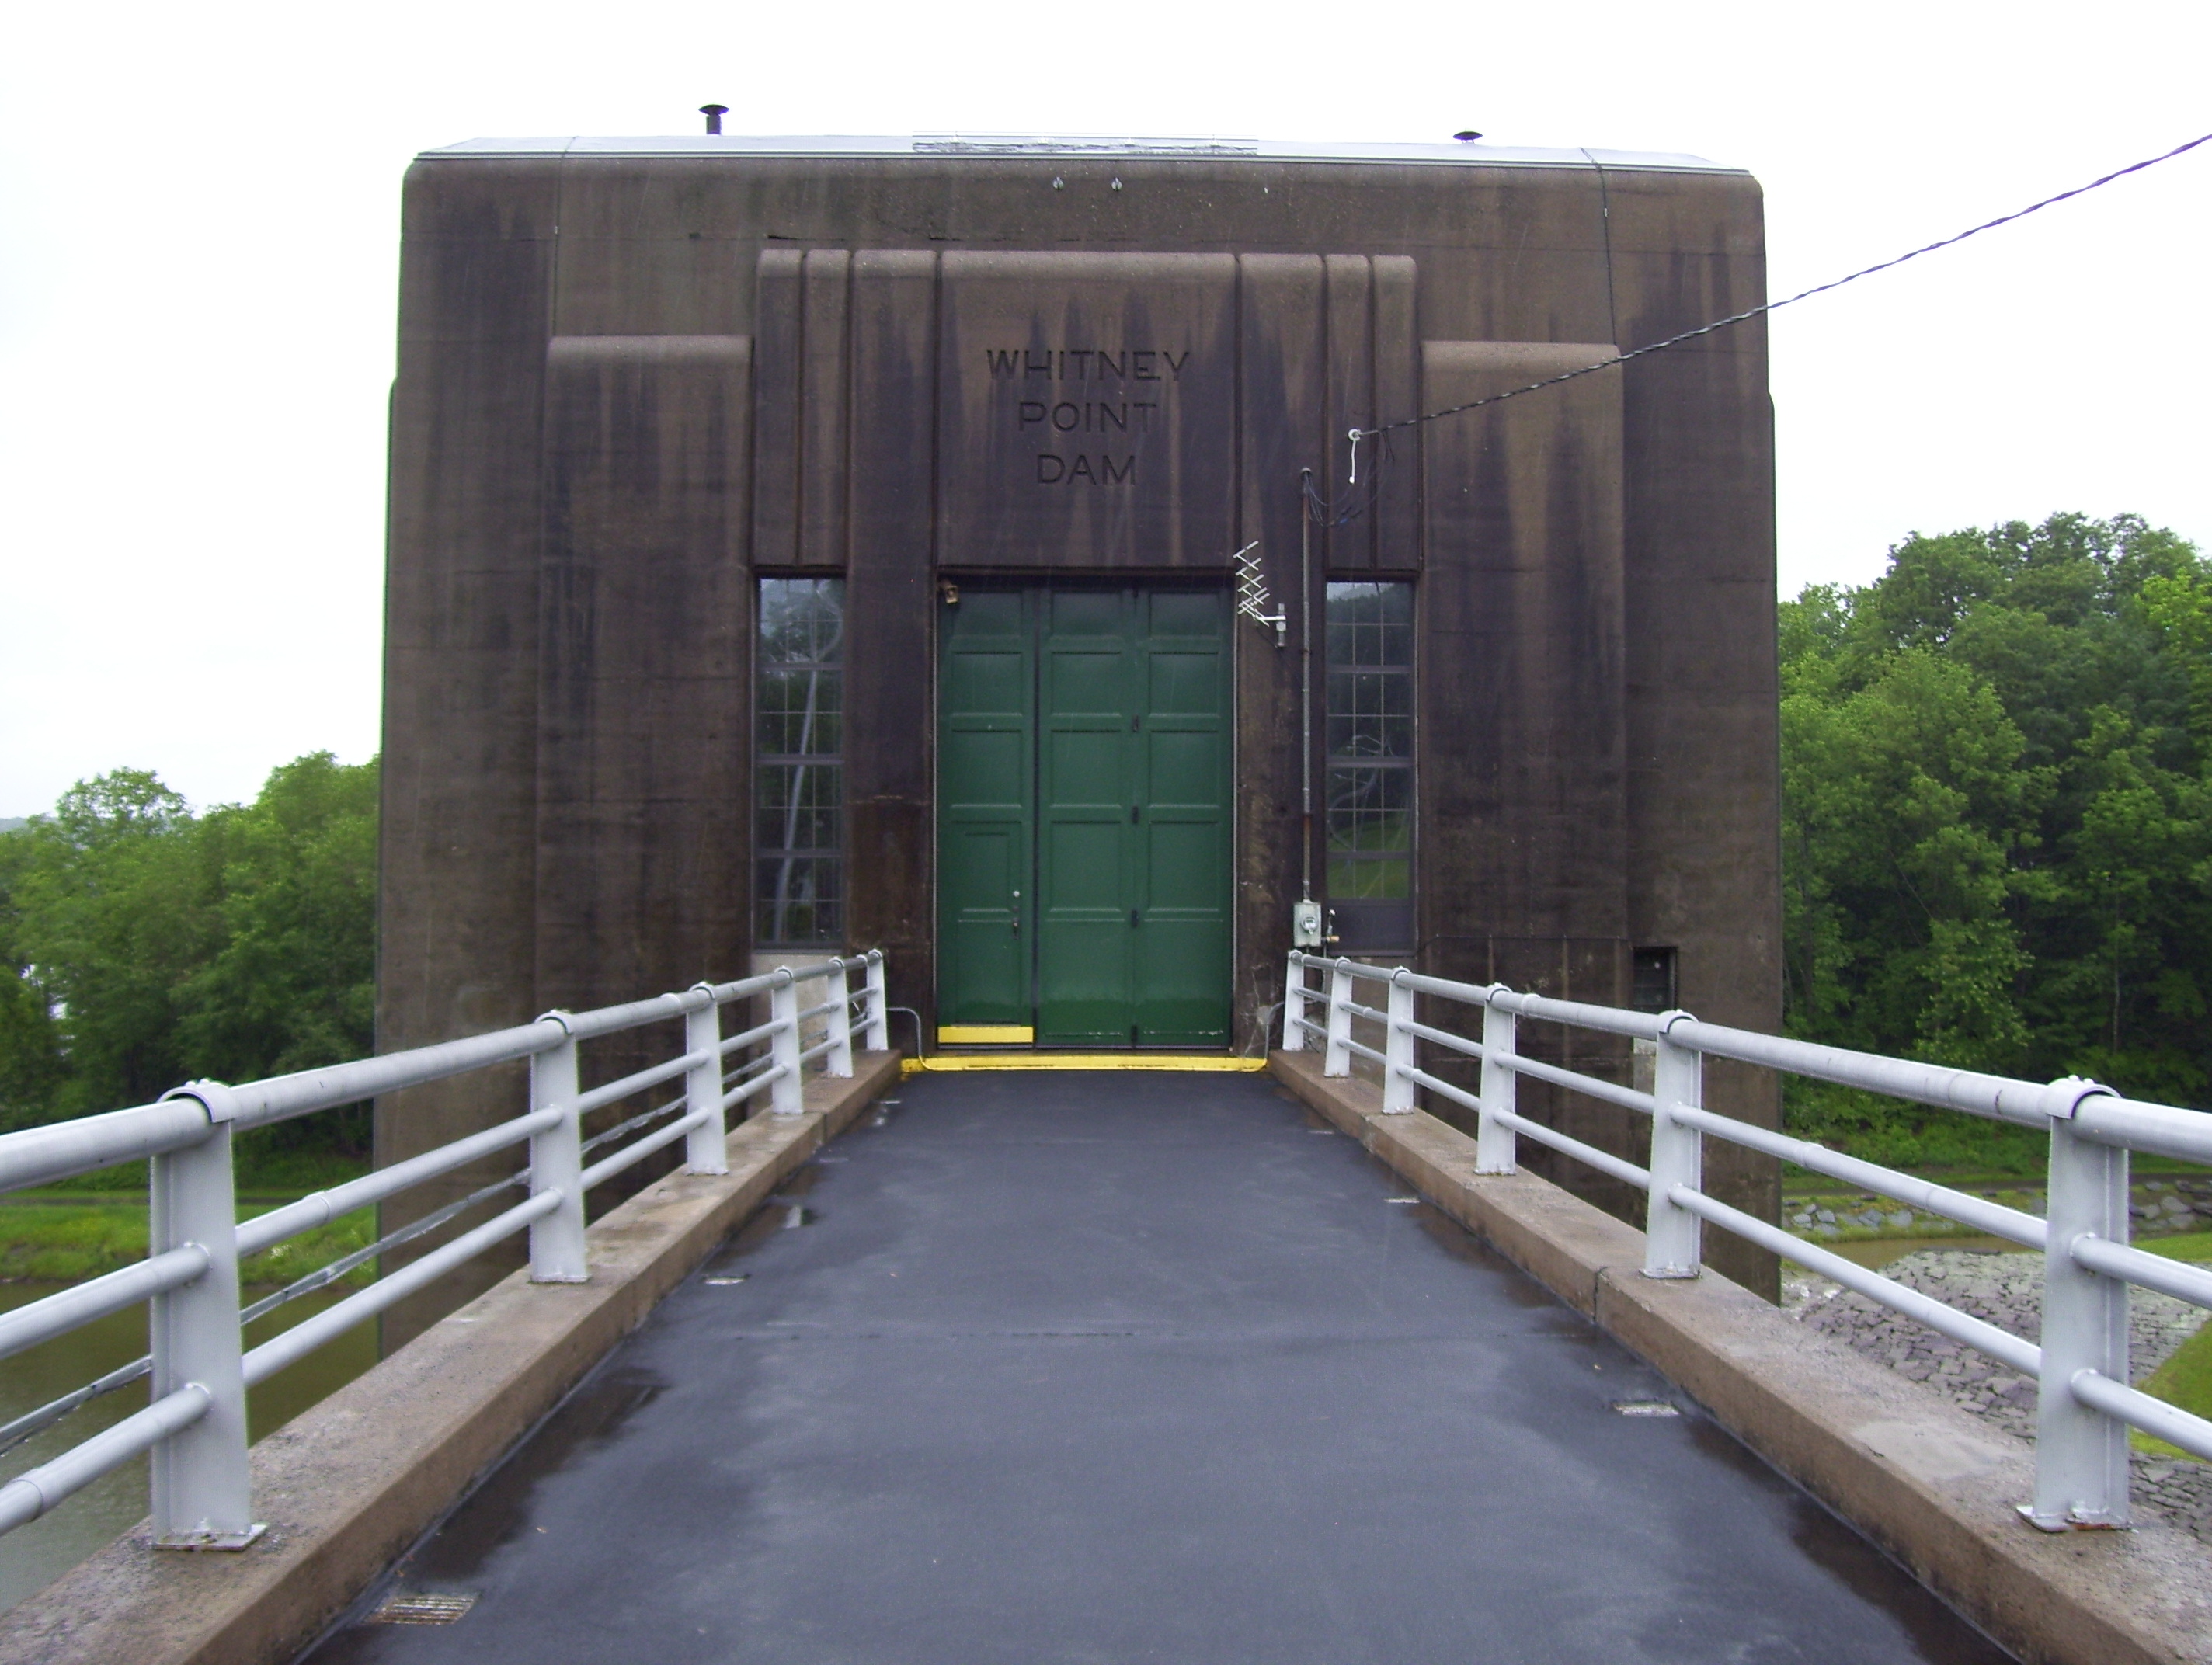 Station image
Summary of all available data for this site
Instantaneous-data availability statement


