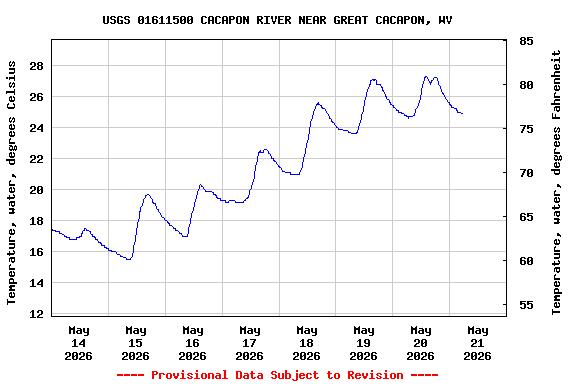
USGS 01611500 CACAPON RIVER NEAR GREAT CACAPON, WV

PROVISIONAL DATA SUBJECT TO REVISION

Click to hidestation-specific text
Station operated in cooperation with the State of West Virginia and West Virginia Department of Environmental Protection

Current shift adjusted stage-discharge rating table. These tab delimited tables are updated daily and can change frequently. If you use these ratings, it is important that you update often so that you have the most current version.
What is a shift adjusted stage-discharge rating?
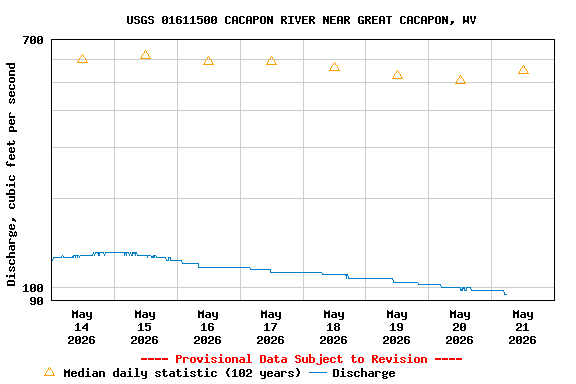
This station managed by the Leetown Field Office.

Available Parameters Available Period
  
2007-10-01  2026-01-18
1994-10-01  2026-01-18
2007-10-01  2026-01-18
2007-10-01  2026-01-18
2007-10-01  2026-01-18
2007-10-01  2026-01-18


 (7)
 

  -- or --


Summary of all available data for this site
Instantaneous-data availability statement


Temperature, water, degrees Celsius

Most recent instantaneous value: 0.4 01-18-2026   22:30 EST
Graph of  Temperature, water, degrees Celsius

Add up to 2 more sites and replot for "Temperature, water, degrees Celsius"

?


Create presentation-quality / stand-alone graph.   Subscribe to WaterAlert      

See this graph on the Monitoring Location Pages


Discharge, cubic feet per second

Most recent instantaneous value: 102 01-18-2026   22:30 EST
Graph of  Discharge, cubic feet per second

Add up to 2 more sites and replot for "Discharge, cubic feet per second"

?


Create presentation-quality / stand-alone graph.   Subscribe to WaterAlert      

See this graph on the Monitoring Location Pages


Daily discharge, cubic feet per second -- statistics for Jan 18 based on 102 water years of record more
Min
(1956)
Most Recent
Instantaneous
Value Jan 18
25th
percen-
tile
Median Mean 75th
percen-
tile
Max
(1991)
60.0 102 177 327 539 617 4980


Gage height, feet

Most recent instantaneous value: 1.61 01-18-2026   22:30 EST
Graph of  Gage height, feet

Add up to 2 more sites and replot for "Gage height, feet"

?


Create presentation-quality / stand-alone graph.   Subscribe to WaterAlert      

See this graph on the Monitoring Location Pages


Specific conductance, water, unfiltered, microsiemens per centimeter at 25 degrees Celsius

Most recent instantaneous value: 206 01-18-2026   22:30 EST
Graph of  Specific conductance, water, unfiltered, microsiemens per centimeter at 25 degrees Celsius

Add up to 2 more sites and replot for "Specific conductance, water, unfiltered, microsiemens per centimeter at 25 degrees Celsius"

?


Create presentation-quality / stand-alone graph.   Subscribe to WaterAlert      

See this graph on the Monitoring Location Pages


Dissolved oxygen, water, unfiltered, milligrams per liter

Most recent instantaneous value: 14.6 01-18-2026   22:30 EST
Graph of  Dissolved oxygen, water, unfiltered, milligrams per liter

Add up to 2 more sites and replot for "Dissolved oxygen, water, unfiltered, milligrams per liter"

?


Create presentation-quality / stand-alone graph.   Subscribe to WaterAlert      

See this graph on the Monitoring Location Pages


pH, water, unfiltered, field, standard units

Most recent instantaneous value: 8.1 01-18-2026   22:30 EST
Graph of  pH, water, unfiltered, field, standard units

Add up to 2 more sites and replot for "pH, water, unfiltered, field, standard units"

?


Create presentation-quality / stand-alone graph.   Subscribe to WaterAlert      

See this graph on the Monitoring Location Pages