PROVISIONAL DATA SUBJECT TO REVISION
Click to hidestation-specific text
|
|
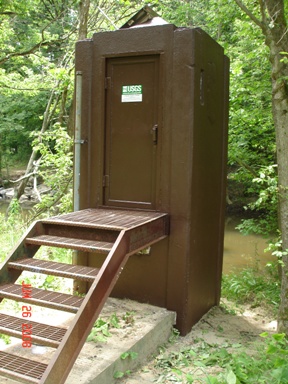 |
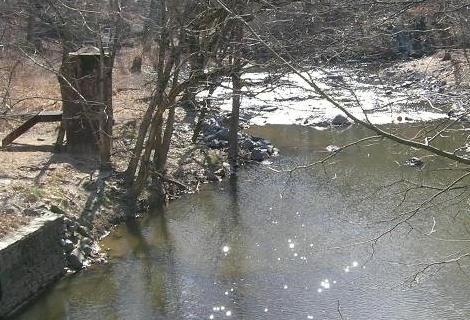
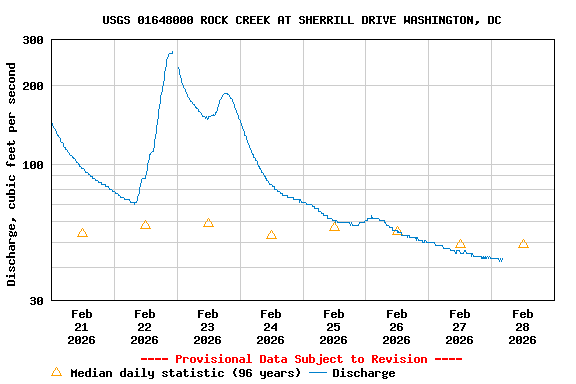
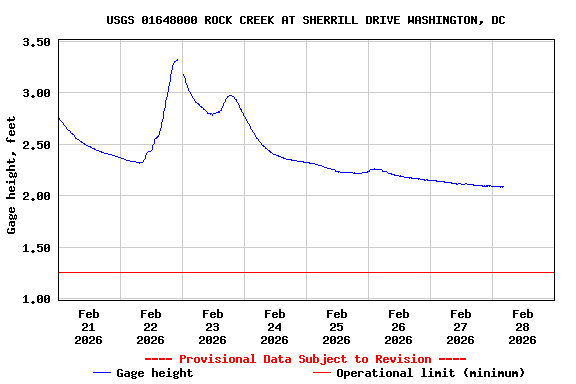
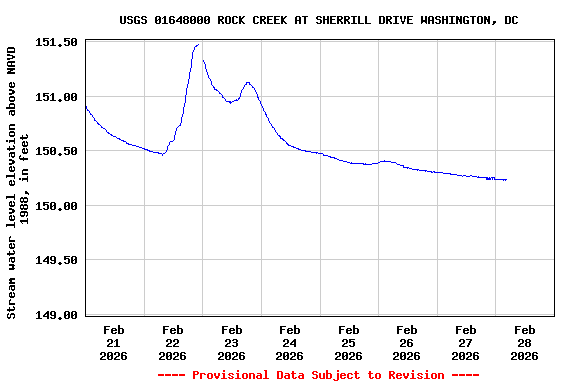
LOCATION.--Lat 38°58'21.0", long 77°02'24.0", Washington, DC, Hydrologic Unit 02070010,
   on left bank 125 ft downstream from Sherrill Drive Bridge in Rock Creek Park in Washington, DC,
   and 7.5 mi upstream from mouth.
DRAINAGE AREA.--62.2 mi2.
PERIOD OF RECORD.--October 1929 to current year.
REVISIONS HISTORY.--WSP 1432: 1933(M).
GAGE.--Water-stage recorder and crest-stage gage. Datum of gage is 148.14 ft above North American
   Vertical Datum of 1988.
REMARKS.--Flow affected by two upstream reservoirs which control flow from about 25 mi2. Needwood
   Lake on Rock Creek since Sept. 1966 and Bernard Frank Lake on North Branch Rock Creek since February
   1968. U.S. Geological Survey satellite data-collection platform at station. Water-quality records for
   some prior periods have been collected at this location.
EXTREMES FOR PERIOD OF RECORD.--Maximum discharge, 12,500 ft³/s, June 22, 1972, gage height, 16.20 ft;
   minimum discharge, 0.44 ft³/s, Oct. 15, 16, 2007.
COOPERATION.--Funding for the operation of this station is provided by the District of Columbia
   Department of the Environment, and the U.S. Geological Survey.
| Boating safety tips |
Summary of all available data for this site
Instantaneous-data availability statement