USGS 02131500 LYNCHES RIVER NEAR BISHOPVILLE, SC

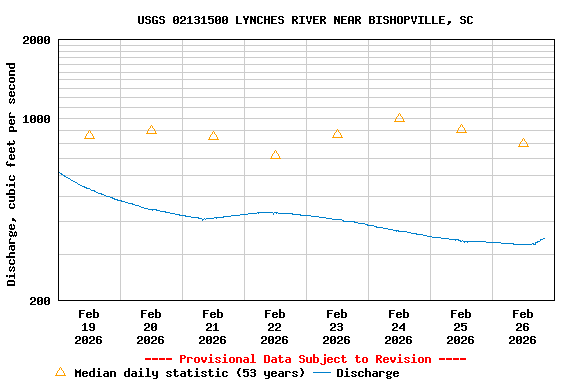
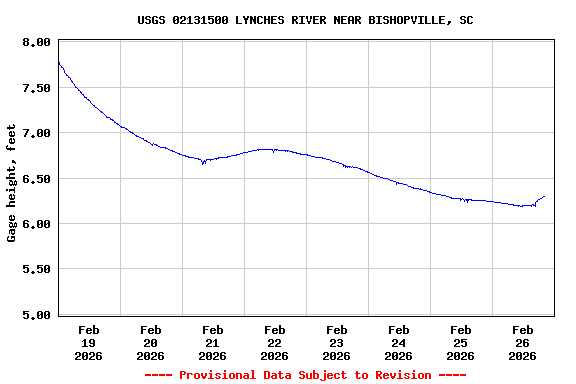
PROVISIONAL DATA SUBJECT TO REVISION

Click to hidestation-specific text
Funding for this site is provided by the cooperators / programs below:
Click to go to the USGS NSIP web page

USGS National Streamflow Information Program


Boating safety tips
This station managed by the South Atlantic WSC Columbia Field Office.

Available Parameters Available Period
  
2007-10-01  2026-01-21
2002-02-06  2026-01-21
2007-10-01  2026-01-21
2023-01-22  2026-01-21


 (7)
 

  -- or --


Summary of all available data for this site
Instantaneous-data availability statement


Precipitation, total, inches

Most recent instantaneous value: 0.00 01-21-2026   21:00 EST
Graph of  Precipitation, total, inches

Add up to 2 more sites and replot for "Precipitation, total, inches"

?


Create presentation-quality / stand-alone graph.   Subscribe to WaterAlert      

See this graph on the Monitoring Location Pages


Discharge, cubic feet per second

Most recent instantaneous value: 370 01-21-2026   21:00 EST
Graph of  Discharge, cubic feet per second

Add up to 2 more sites and replot for "Discharge, cubic feet per second"

?


Create presentation-quality / stand-alone graph.   Subscribe to WaterAlert      

See this graph on the Monitoring Location Pages


Daily discharge, cubic feet per second -- statistics for Jan 21 based on 52 water years of record more
Min
(1957)
Most Recent
Instantaneous
Value Jan 21
25th
percen-
tile
Median Mean 75th
percen-
tile
Max
(1943)
297 370 495 728 1020 1040 5340


Gage height, feet

Most recent instantaneous value: 6.45 01-21-2026   21:00 EST
Graph of  Gage height, feet

Add up to 2 more sites and replot for "Gage height, feet"

?


Create presentation-quality / stand-alone graph.   Subscribe to WaterAlert      

See this graph on the Monitoring Location Pages


Stream water level elevation above NAVD 1988, in feet

Most recent instantaneous value: 161.36 01-21-2026   21:00 EST
Graph of  Stream water level elevation above NAVD 1988, in feet

Add up to 2 more sites and replot for "Stream water level elevation above NAVD 1988, in feet"

?


Create presentation-quality / stand-alone graph.   Subscribe to WaterAlert      

See this graph on the Monitoring Location Pages