USGS 02172002 LAKE MOULTRIE TAILRACE CANAL AT MONCKS CORNER, SC

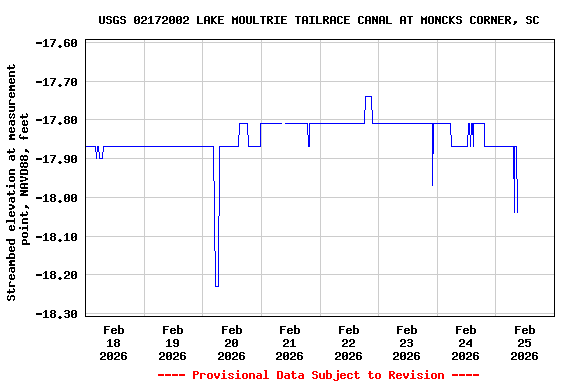
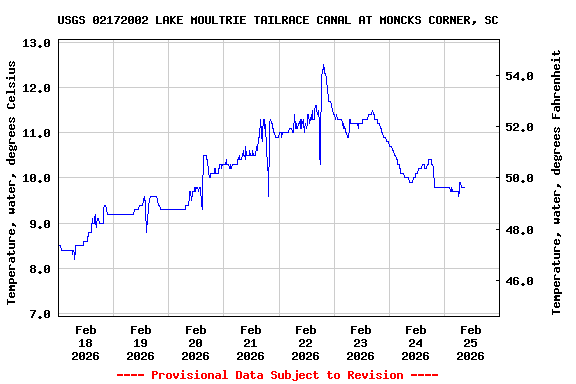
PROVISIONAL DATA SUBJECT TO REVISION

Click to hidestation-specific text
Funding for this site is provided by the cooperators / programs below:
Click to go to the Corps of Engineers web page

U.S. Army Corps of Engineers--Charleston District


This station managed by the South Atlantic WSC Charleston Field Office.

Available Parameters Available Period
  
2016-06-24  2025-11-20
1998-10-01  2025-11-20
2007-10-01  2025-11-20
2016-06-24  2025-11-20
2022-11-21  2025-11-20
2022-11-21  2025-11-20
2022-11-21  2025-11-20


 (7)
 

  -- or --


Summary of all available data for this site
Instantaneous-data availability statement


Temperature, water, degrees Celsius

Most recent instantaneous value: 14.7 11-20-2025   16:45 EST
Graph of  Temperature, water, degrees Celsius

Add up to 2 more sites and replot for "Temperature, water, degrees Celsius"

?


Create presentation-quality / stand-alone graph.   Subscribe to WaterAlert      

See this graph on the Monitoring Location Pages


Discharge, cubic feet per second, [Q AVM]

Most recent instantaneous value: 14800 11-20-2025   16:45 EST
Graph of  Discharge, cubic feet per second, [Q AVM]

Add up to 2 more sites and replot for "Discharge, cubic feet per second, [Q AVM]"

?


Create presentation-quality / stand-alone graph.   Subscribe to WaterAlert      

See this graph on the Monitoring Location Pages


Daily discharge, cubic feet per second -- statistics for Nov 20 based on 23 water years of record more
Min
(2002)
25th
percen-
tile
Median Mean 75th
percen-
tile
Max
(2025)
Most Recent
Instantaneous
Value Nov 20
3490 4810 5140 5490 5990 8460 14800


Gage height, feet

Most recent instantaneous value: 7.15 11-20-2025   16:45 EST
Graph of  Gage height, feet

Add up to 2 more sites and replot for "Gage height, feet"

?


Create presentation-quality / stand-alone graph.   Subscribe to WaterAlert      

See this graph on the Monitoring Location Pages


Dissolved oxygen, water, unfiltered, milligrams per liter

Most recent instantaneous value: 9.6 11-20-2025   16:45 EST
Graph of  Dissolved oxygen, water, unfiltered, milligrams per liter

Add up to 2 more sites and replot for "Dissolved oxygen, water, unfiltered, milligrams per liter"

?


Create presentation-quality / stand-alone graph.   Subscribe to WaterAlert      

See this graph on the Monitoring Location Pages


Stream water level elevation above NAVD 1988, in feet

Most recent instantaneous value: 2.07 11-20-2025   16:45 EST
Graph of  Stream water level elevation above NAVD 1988, in feet

Add up to 2 more sites and replot for "Stream water level elevation above NAVD 1988, in feet"

?


Create presentation-quality / stand-alone graph.   Subscribe to WaterAlert      

See this graph on the Monitoring Location Pages


Streambed elevation at measurement point, NAVD88, feet, LEFT_PIER

Most recent instantaneous value: -20.21 11-20-2025   16:45 EST
Graph of  Streambed elevation at measurement point, NAVD88, feet

Add up to 2 more sites and replot for "Streambed elevation at measurement point, NAVD88, feet, LEFT_PIER"

?


Create presentation-quality / stand-alone graph.   Subscribe to WaterAlert      

See this graph on the Monitoring Location Pages


Streambed elevation at measurement point, NAVD88, feet, RIGHT_PIER

Most recent instantaneous value: -17.74 11-20-2025   16:45 EST
Graph of  Streambed elevation at measurement point, NAVD88, feet

Add up to 2 more sites and replot for "Streambed elevation at measurement point, NAVD88, feet, RIGHT_PIER"

?


Create presentation-quality / stand-alone graph.   Subscribe to WaterAlert      

See this graph on the Monitoring Location Pages