USGS 02313700 WACCASASSA RIVER NR GULF HAMMOCK, FLA.

PROVISIONAL DATA SUBJECT TO REVISION

Click to hidestation-specific text

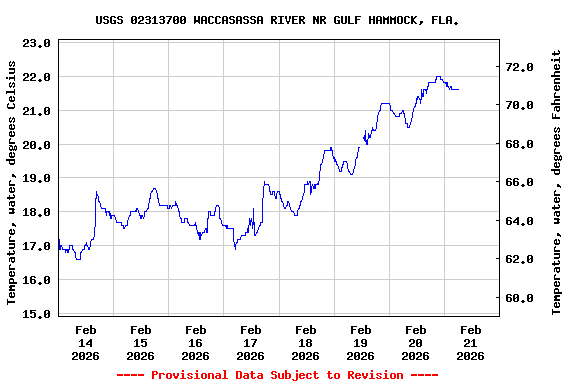
This gage is monitored in cooperation with the Suwannee River Water Management District.
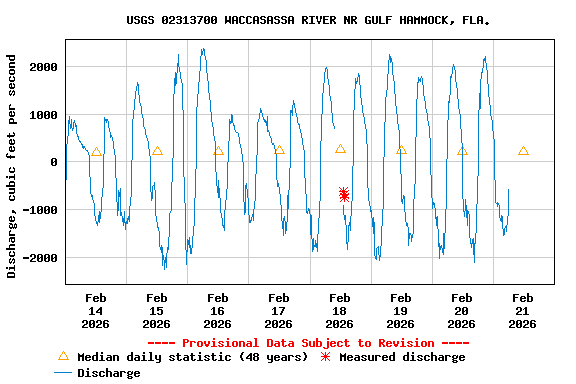
Link to the Suwannee River Water Management District

Available Parameters Available Period
  
2007-10-01  2026-01-19
1986-10-01  2026-01-19
2007-10-01  2026-01-19
2018-09-12  2026-01-19
2018-09-12  2026-01-19
2018-09-12  2025-11-17
2007-10-01  2009-09-30
2014-10-01  2026-01-19
2009-10-02  2026-01-17
2025-09-21  2026-01-19


 (7)
 

  -- or --


Summary of all available data for this site
Instantaneous-data availability statement


Temperature, water, degrees Celsius

Most recent instantaneous value: 14.0 01-19-2026   02:00 EST
Graph of  Temperature, water, degrees Celsius

Add up to 2 more sites and replot for "Temperature, water, degrees Celsius"

?


Create presentation-quality / stand-alone graph.   Subscribe to WaterAlert      

See this graph on the Monitoring Location Pages


Discharge, cubic feet per second

Most recent instantaneous value: 235 01-19-2026   02:00 EST
Graph of  Discharge, cubic feet per second

Add up to 2 more sites and replot for "Discharge, cubic feet per second"

?


Create presentation-quality / stand-alone graph.   Subscribe to WaterAlert      

See this graph on the Monitoring Location Pages


Daily discharge, cubic feet per second -- statistics for Jan 19 based on 51 water years of record more
Min
(2001)
25th
percen-
tile
Median Most Recent
Instantaneous
Value Jan 19
Mean 75th
percen-
tile
Max
(1988)
-211 104 206 235 235 306 1130


Gage height, feet

Most recent instantaneous value: 11.55 01-19-2026   02:00 EST
Graph of  Gage height, feet

Add up to 2 more sites and replot for "Gage height, feet"

?


Create presentation-quality / stand-alone graph.   Subscribe to WaterAlert      

See this graph on the Monitoring Location Pages


Specific conductance, water, unfiltered, microsiemens per centimeter at 25 degrees Celsius

Most recent instantaneous value: 17700 01-19-2026   02:00 EST
Graph of  Specific conductance, water, unfiltered, microsiemens per centimeter at 25 degrees Celsius

Add up to 2 more sites and replot for "Specific conductance, water, unfiltered, microsiemens per centimeter at 25 degrees Celsius"

?


Create presentation-quality / stand-alone graph.   Subscribe to WaterAlert      

See this graph on the Monitoring Location Pages


Dissolved oxygen, water, unfiltered, milligrams per liter

Most recent instantaneous value: 7.4 01-19-2026   02:00 EST
Graph of  Dissolved oxygen, water, unfiltered, milligrams per liter

Add up to 2 more sites and replot for "Dissolved oxygen, water, unfiltered, milligrams per liter"

?


Create presentation-quality / stand-alone graph.   Subscribe to WaterAlert      

See this graph on the Monitoring Location Pages


pH, water, unfiltered, field, standard units
 
-- Data temporarily unavailable for the time period specified --

Salinity, water, unfiltered, parts per thousand
 
-- Data temporarily unavailable for the time period specified --


Stream water level elevation above NAVD 1988, in feet

Most recent instantaneous value: 0.26 01-19-2026   02:00 EST
Graph of  Stream water level elevation above NAVD 1988, in feet

Add up to 2 more sites and replot for "Stream water level elevation above NAVD 1988, in feet"

?


Create presentation-quality / stand-alone graph.   Subscribe to WaterAlert      

See this graph on the Monitoring Location Pages


Discharge, tidally filtered, cubic feet per second

Most recent instantaneous value: 13.6 01-17-2026   14:00 EST
Graph of  Discharge, tidally filtered, cubic feet per second

Add up to 2 more sites and replot for "Discharge, tidally filtered, cubic feet per second"

?


Create presentation-quality / stand-alone graph.   Subscribe to WaterAlert      

See this graph on the Monitoring Location Pages


Mean water velocity for discharge computation, feet per second

Most recent instantaneous value: 0.23 01-19-2026   02:00 EST
Graph of  Mean water velocity for discharge computation, feet per second

Add up to 2 more sites and replot for "Mean water velocity for discharge computation, feet per second"

?


Create presentation-quality / stand-alone graph.   Subscribe to WaterAlert      

See this graph on the Monitoring Location Pages