USGS 02334653 CHATTAHOOCHEE R 0.76 MI US MCGINNIS FY SUWANEE GA

PROVISIONAL DATA SUBJECT TO REVISION

Click to hidestation-specific text
The USGS operation and maintenance of this gaging station is funded in cooperation with Forsyth County, Georgia.

Beginning October 1, 2017, the precipitation data for this station, labeled 00045 Precipitation [Operational], are temporary and will only be displayed for 120 days. Time series of 15-minute interval or cumulative daily values will NOT be available for retrieval following the 120-day display period. Precipitation data prior to October 1, 2017, labeled 00045 Precipitation, may be available.
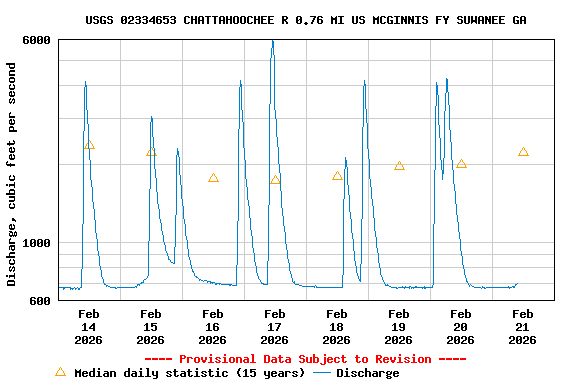
This station managed by the South Atlantic WSC Atlanta Field Office.

Available Parameters Available Period
  
2010-08-24  2025-10-30
2025-07-02  2025-10-30
2010-10-21  2025-10-30
2010-07-17  2025-10-30
2010-07-17  2025-10-30


 (7)
 

  -- or --


Summary of all available data for this site
Instantaneous-data availability statement


Temperature, water, degrees Celsius

Most recent instantaneous value: 13.5 10-30-2025   21:30 EDT
Graph of

Add up to 2 more sites and replot for "Temperature, water, degrees Celsius"

?


Create presentation-quality / stand-alone graph.   Subscribe to WaterAlert      

See this graph on the Monitoring Location Pages


Temperature, water, degrees Fahrenheit

Most recent instantaneous value: 56.2 10-30-2025   21:30 EDT
Graph of  Temperature, water, degrees Fahrenheit

Add up to 2 more sites and replot for "Temperature, water, degrees Fahrenheit"

?


Create presentation-quality / stand-alone graph.   Subscribe to WaterAlert      

See this graph on the Monitoring Location Pages


Precipitation, total, inches

Most recent instantaneous value: 0.00 10-30-2025   21:30 EDT
Graph of  Precipitation, total, inches

Add up to 2 more sites and replot for "Precipitation, total, inches"

?


Create presentation-quality / stand-alone graph.   Subscribe to WaterAlert      

See this graph on the Monitoring Location Pages


Discharge, cubic feet per second

Most recent instantaneous value: 1630 10-30-2025   21:30 EDT
Graph of

Add up to 2 more sites and replot for "Discharge, cubic feet per second"

?


Create presentation-quality / stand-alone graph.   Subscribe to WaterAlert      

See this graph on the Monitoring Location Pages


Daily discharge, cubic feet per second -- statistics for Oct 30 based on 15 water years of record more
Min
(2012)
25th
percen-
tile
Median Most Recent
Instantaneous
Value Oct 30
Mean 75th
percen-
tile
Max
(2021)
786 1070 1490 1630 1790 1900 5820


Gage height, feet

Most recent instantaneous value: 2.73 10-30-2025   21:30 EDT
Graph of

Add up to 2 more sites and replot for "Gage height, feet"

?


Create presentation-quality / stand-alone graph.   Subscribe to WaterAlert      

See this graph on the Monitoring Location Pages