USGS 02428400 ALABAMA RIVER AT CLAIBORNE L&D NEAR MONROEVILLE

PROVISIONAL DATA SUBJECT TO REVISION

Click to hidestation-specific text
Alabama River

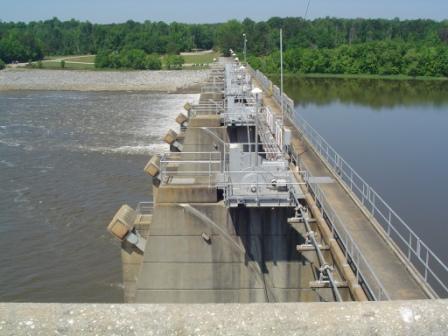
NOTE: Discharge is computed based on flow through the dam. Flow over the dam is not computed, therefore, discharge data are not available for stages above 50 feet.

> WaterNow – get the latest gage data from your mobile phone or email.
> Rating Information
This station managed by the Montgomery Field Office.

Available Parameters Available Period
  
2007-10-01  2025-09-03
2007-10-01  2025-09-03
2025-05-06  2025-09-03
2025-05-06  2025-09-03
2025-05-06  2025-09-03
2025-05-06  2025-09-03
2025-05-06  2025-09-03
2025-05-06  2025-09-03


 (7)
 

  -- or --


Summary of all available data for this site
Instantaneous-data availability statement


Discharge, cubic feet per second

Most recent instantaneous value: 9350 09-03-2025   07:00 CDT
Graph of  Discharge, cubic feet per second

Add up to 2 more sites and replot for "Discharge, cubic feet per second"

?


Create presentation-quality / stand-alone graph.   Subscribe to WaterAlert      

See this graph on the Monitoring Location Pages


Daily discharge, cubic feet per second -- statistics for Sep 3 based on 47 water years of record more
Min
(2012)
25th
percen-
tile
Median Most Recent
Instantaneous
Value Sep 3
Mean 75th
percen-
tile
Max
(2021)
4010 6560 8310 9350 11100 12600 65400


Gage height, feet

Most recent instantaneous value: 35.43 09-03-2025   07:00 CDT
Graph of  Gage height, feet

Add up to 2 more sites and replot for "Gage height, feet"

?


Create presentation-quality / stand-alone graph.   Subscribe to WaterAlert      

See this graph on the Monitoring Location Pages


Gate opening, height, feet, GATE 1

Most recent instantaneous value: 0.30 09-03-2025   07:00 CDT
Graph of  Gate opening, height, feet

Add up to 2 more sites and replot for "Gate opening, height, feet, GATE 1"

?


Create presentation-quality / stand-alone graph.   Subscribe to WaterAlert      

See this graph on the Monitoring Location Pages


Gate opening, height, feet, GATE 2

Most recent instantaneous value: 0.10 09-03-2025   07:00 CDT
Graph of  Gate opening, height, feet

Add up to 2 more sites and replot for "Gate opening, height, feet, GATE 2"

?


Create presentation-quality / stand-alone graph.   Subscribe to WaterAlert      

See this graph on the Monitoring Location Pages


Gate opening, height, feet, GATE 3

Most recent instantaneous value: 0.00 09-03-2025   07:00 CDT
Graph of  Gate opening, height, feet

Add up to 2 more sites and replot for "Gate opening, height, feet, GATE 3"

?


Create presentation-quality / stand-alone graph.   Subscribe to WaterAlert      

See this graph on the Monitoring Location Pages


Gate opening, height, feet, GATE 4

Most recent instantaneous value: 0.00 09-03-2025   07:00 CDT
Graph of  Gate opening, height, feet

Add up to 2 more sites and replot for "Gate opening, height, feet, GATE 4"

?


Create presentation-quality / stand-alone graph.   Subscribe to WaterAlert      

See this graph on the Monitoring Location Pages


Gate opening, height, feet, GATE 5

Most recent instantaneous value: 0.63 09-03-2025   07:00 CDT
Graph of  Gate opening, height, feet

Add up to 2 more sites and replot for "Gate opening, height, feet, GATE 5"

?


Create presentation-quality / stand-alone graph.   Subscribe to WaterAlert      

See this graph on the Monitoring Location Pages


Gate opening, height, feet, GATE 6

Most recent instantaneous value: 0.63 09-03-2025   07:00 CDT
Graph of  Gate opening, height, feet

Add up to 2 more sites and replot for "Gate opening, height, feet, GATE 6"

?


Create presentation-quality / stand-alone graph.   Subscribe to WaterAlert      

See this graph on the Monitoring Location Pages