USGS 03144816 South Fork Licking River at Kirkersville OH

PROVISIONAL DATA SUBJECT TO REVISION

Click to hidestation-specific text
Funding for this site is provided by:


> WaterNow – get the latest gage data from your mobile phone or email.
> Rating Information
Available Parameters Available Period
  
2024-01-02  2024-05-01
2007-10-17  2024-05-01
2007-10-16  2024-05-01


 (7)
 

  -- or --


Summary of all available data for this site
Instantaneous-data availability statement
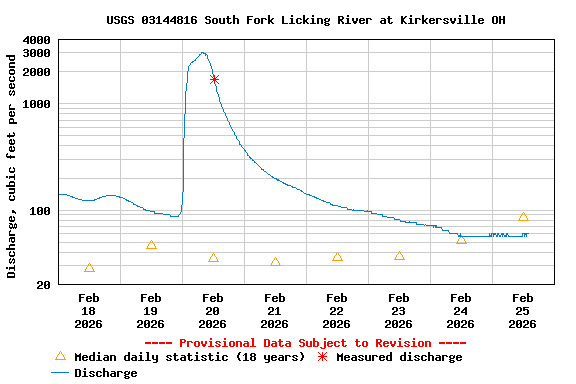

Precipitation, total, inches

Most recent instantaneous value: 0.00 05-01-2024   07:00 EDT
Graph of  Precipitation, total, inches

Add up to 2 more sites and replot for "Precipitation, total, inches"

?


Create presentation-quality / stand-alone graph.   Subscribe to WaterAlert      

See this graph on the Monitoring Location Pages


Discharge, cubic feet per second

Most recent instantaneous value: 15.9 05-01-2024   07:00 EDT
Graph of  Discharge, cubic feet per second

Add up to 2 more sites and replot for "Discharge, cubic feet per second"

?


Create presentation-quality / stand-alone graph.   Subscribe to WaterAlert      

See this graph on the Monitoring Location Pages


Daily discharge, cubic feet per second -- statistics for May 1 based on 16 water years of record more
Min
(2008)
Most Recent
Instantaneous
Value May 1
25th
percen-
tile
Median Mean 75th
percen-
tile
Max
(2014)
11.8 15.9 22 51 97 157 338


Gage height, feet

Most recent instantaneous value: 4.72 05-01-2024   07:00 EDT
Graph of  Gage height, feet

Add up to 2 more sites and replot for "Gage height, feet"

?


Create presentation-quality / stand-alone graph.   Subscribe to WaterAlert      

See this graph on the Monitoring Location Pages