USGS 03353611 WHITE R. AT STOUT GEN. STN. AT INDIANAPOLIS, IN

PROVISIONAL DATA SUBJECT TO REVISION

Click to hidestation-specific text

This gaging station is maintained in cooperation with:

  • AES Harding Street

Boating safety tips
This station managed by the Indiana Water Science Center Office.

Available Parameters Available Period
  
2007-10-01  2026-02-19
1992-11-26  2026-02-19
2007-10-01  2026-02-19
2025-10-21  2026-02-19
2025-10-21  2026-02-19


 (7)
 

  -- or --


Summary of all available data for this site
Instantaneous-data availability statement


Temperature, water, degrees Celsius

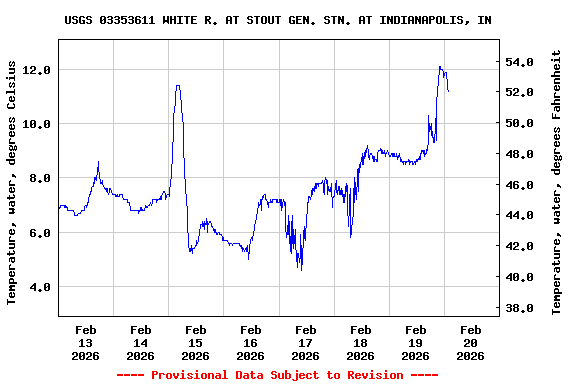
Most recent instantaneous value: 11.7 02-19-2026   23:45 EST
Graph of  Temperature, water, degrees Celsius

Add up to 2 more sites and replot for "Temperature, water, degrees Celsius"

?


Create presentation-quality / stand-alone graph.   Subscribe to WaterAlert      

See this graph on the Monitoring Location Pages


Discharge, cubic feet per second

Most recent instantaneous value: 1990 02-19-2026   23:45 EST
Graph of  Discharge, cubic feet per second

Add up to 2 more sites and replot for "Discharge, cubic feet per second"

?


Create presentation-quality / stand-alone graph.   Subscribe to WaterAlert      

See this graph on the Monitoring Location Pages


Daily discharge, cubic feet per second -- statistics for Feb 20 based on 33 water years of record more
Min
(1996)
25th
percen-
tile
Median Most Recent
Instantaneous
Value Feb 20
Mean 75th
percen-
tile
Max
(2022)
580 1090 1930 1990 2530 3070 11600


Gage height, feet

Most recent instantaneous value: 3.55 02-19-2026   23:45 EST
Graph of  Gage height, feet

Add up to 2 more sites and replot for "Gage height, feet"

?


Create presentation-quality / stand-alone graph.   Subscribe to WaterAlert      

See this graph on the Monitoring Location Pages


Stream water level elevation above NGVD 1929, in feet

Most recent instantaneous value: 666.95 02-19-2026   23:45 EST
Graph of  Stream water level elevation above NGVD 1929, in feet

Add up to 2 more sites and replot for "Stream water level elevation above NGVD 1929, in feet"

?


Create presentation-quality / stand-alone graph.   Subscribe to WaterAlert      

See this graph on the Monitoring Location Pages


Stream water level elevation above NAVD 1988, in feet

Most recent instantaneous value: 666.28 02-19-2026   23:45 EST
Graph of  Stream water level elevation above NAVD 1988, in feet

Add up to 2 more sites and replot for "Stream water level elevation above NAVD 1988, in feet"

?


Create presentation-quality / stand-alone graph.   Subscribe to WaterAlert      

See this graph on the Monitoring Location Pages