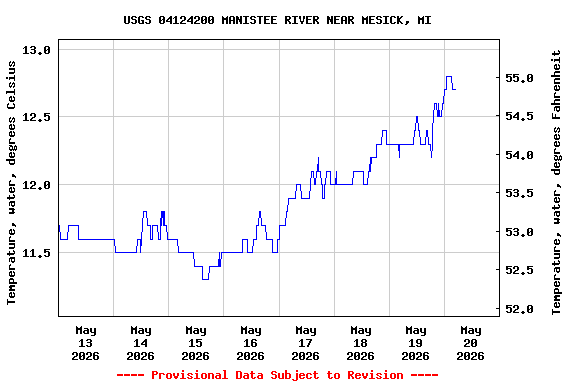
USGS 04124200 MANISTEE RIVER NEAR MESICK, MI

PROVISIONAL DATA SUBJECT TO REVISION

Click to hidestation-specific text
This station managed by the GRAYLING FIELD OFFICE.

Available Parameters Available Period
  
2007-10-01  2024-05-17
1996-12-01  2024-05-17
2017-10-01  2024-05-17
2007-10-01  2024-05-17
2020-10-21  2024-05-17


 (7)
 

  -- or --


Summary of all available data for this site
Instantaneous-data availability statement


Temperature, water, degrees Celsius

Most recent instantaneous value: 15.6 05-17-2024   08:00 EST
Graph of  Temperature, water, degrees Celsius

Add up to 2 more sites and replot for "Temperature, water, degrees Celsius"

?


Create presentation-quality / stand-alone graph.   Subscribe to WaterAlert      

See this graph on the Monitoring Location Pages


Discharge, cubic feet per second

Most recent instantaneous value: 1130 05-17-2024   08:00 EST
Graph of  Discharge, cubic feet per second

Add up to 2 more sites and replot for "Discharge, cubic feet per second"

?


Create presentation-quality / stand-alone graph.   Subscribe to WaterAlert      

See this graph on the Monitoring Location Pages


Daily discharge, cubic feet per second -- statistics for May 17 based on 27 water years of record more
Min
(1999)
Most Recent
Instantaneous
Value May 17
25th
percen-
tile
Median Mean 75th
percen-
tile
Max
(2001)
1030 1130 1170 1350 1390 1430 2580


Gage height, feet

Most recent instantaneous value: 3.89 05-17-2024   08:00 EST
Graph of  Gage height, feet

Add up to 2 more sites and replot for "Gage height, feet"

?


Create presentation-quality / stand-alone graph.   Subscribe to WaterAlert      

See this graph on the Monitoring Location Pages


Dissolved oxygen, water, unfiltered, milligrams per liter

Most recent instantaneous value: 9.0 05-17-2024   08:00 EST
Graph of  Dissolved oxygen, water, unfiltered, milligrams per liter

Add up to 2 more sites and replot for "Dissolved oxygen, water, unfiltered, milligrams per liter"

?


Create presentation-quality / stand-alone graph.   Subscribe to WaterAlert      

See this graph on the Monitoring Location Pages


Stream water level elevation above NAVD 1988, in feet

Most recent instantaneous value: 735.84 05-17-2024   08:00 EST
Graph of  Stream water level elevation above NAVD 1988, in feet

Add up to 2 more sites and replot for "Stream water level elevation above NAVD 1988, in feet"

?


Create presentation-quality / stand-alone graph.   Subscribe to WaterAlert      

See this graph on the Monitoring Location Pages