Most recent instantaneous value: 1.4 02-25-2026 07:15 EST

See this graph on the Monitoring Location Pages
Station operated in cooperation with Consumers Energy and the Michigan Department of Environment, Great Lakes and Energy.
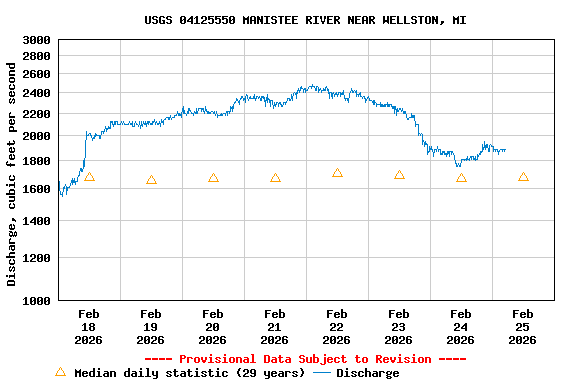
| Min (2003) | 25th percen- tile | Median | Mean | Most Recent Instantaneous Value Feb 25 | 75th percen- tile | Max (2017) |
|---|---|---|---|---|---|---|
| 1280 | 1600 | 1680 | 1780 | 1910 | 1920 | 3070 |

![]() U.S. Department of the Interior |
U.S. Geological Survey
U.S. Department of the Interior |
U.S. Geological Survey
Title: USGS Current Conditions for the Nation
URL:
Page Contact Information: Michigan Water Data Support Team
Page Last Modified: 2026-02-25 07:38:18 EST
2.78 1.96 vaww01