USGS 05059300 SHEYENNE R AB SHEYENNE R DIVERSION NR HORACE, ND

PROVISIONAL DATA SUBJECT TO REVISION

Click to hidestation-specific text
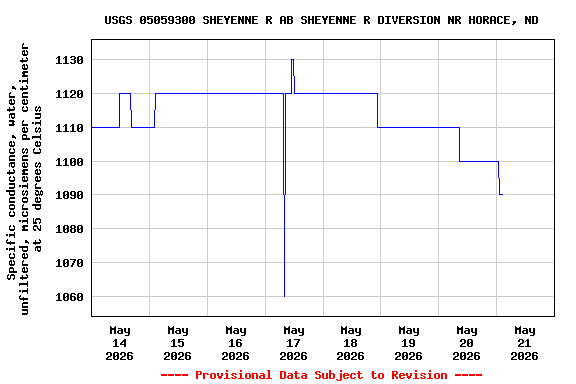
  Water Quality data provided in
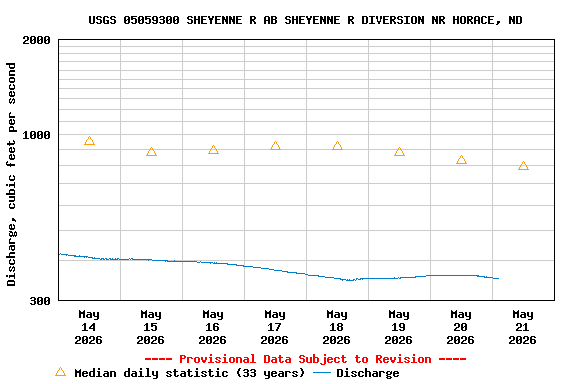
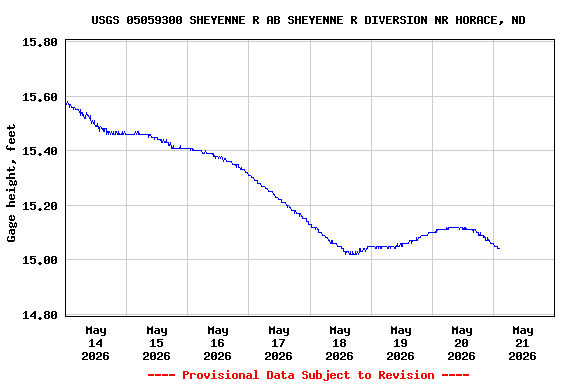
 cooperation with the

North Dakota State Water Commission logo

Gage height and discharge data provided in cooperation with the

Red River Joint Water Resource District


This station managed by the Grand Forks Field Office.

Available Parameters Available Period
  
2007-10-01  2025-11-13
1994-10-01  2026-01-31
2007-10-01  2026-01-31
2007-10-01  2025-11-13
2025-01-01  2026-01-31


 (7)
 

  -- or --


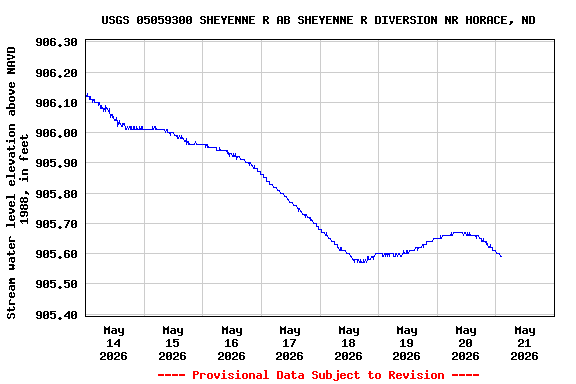
Summary of all available data for this site
Instantaneous-data availability statement

Temperature, water, degrees Celsius
 
-- Data temporarily unavailable for the time period specified --


Discharge, cubic feet per second

Most recent instantaneous value: Ice 01-31-2026   11:15 CST
Graph of  Discharge, cubic feet per second

Add up to 2 more sites and replot for "Discharge, cubic feet per second"

?


Create presentation-quality / stand-alone graph.   Subscribe to WaterAlert      

See this graph on the Monitoring Location Pages


Daily discharge, cubic feet per second -- statistics for Jan 31 based on 32 water years of record more
Most Recent
Instantaneous
Value Jan 31
Min
(2003)
25th
percen-
tile
Median Mean 75th
percen-
tile
Max
(2020)
-- unavailable -- 69.6 122 150 201 258 546


Gage height, feet

Most recent instantaneous value: 13.96 01-31-2026   11:15 CST
Graph of  Gage height, feet

Add up to 2 more sites and replot for "Gage height, feet"

?


Create presentation-quality / stand-alone graph.   Subscribe to WaterAlert      

See this graph on the Monitoring Location Pages


Specific conductance, water, unfiltered, microsiemens per centimeter at 25 degrees Celsius
 
-- Data temporarily unavailable for the time period specified --


Stream water level elevation above NAVD 1988, in feet

Most recent instantaneous value: 904.51 01-31-2026   11:15 CST
Graph of  Stream water level elevation above NAVD 1988, in feet

Add up to 2 more sites and replot for "Stream water level elevation above NAVD 1988, in feet"

?


Create presentation-quality / stand-alone graph.   Subscribe to WaterAlert      

See this graph on the Monitoring Location Pages