Most recent instantaneous value: 4.8 02-20-2026 23:30 CST
See this graph on the Monitoring Location Pages
Discharge, cubic feet per second |
||
|
||
Gage height, feet |
||
|
||
Orthophosphate, water, in situ, milligrams per liter as phosphorus, (CYC) |
||
|
||
Orthophosphate, water, in situ, milligrams per liter as phosphorus, (PAX) |
||
|
||
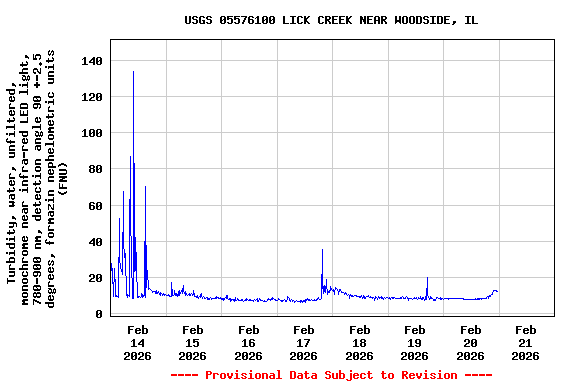
Turbidity, water, unfiltered, monochrome near infra-red LED light, 780-900 nm, detection angle 90 +-2.5 degrees, formazin nephelometric units (FNU), (HACH) |
||
|
||
Water velocity reading from field sensor, feet per second, (X AVERAGE) |
||
|
||
![]() U.S. Department of the Interior |
U.S. Geological Survey
U.S. Department of the Interior |
U.S. Geological Survey
Title: USGS Current Conditions for the Nation
URL:
Page Contact Information: Illinois Water Data Support Team
Page Last Modified: 2026-02-21 15:05:34 EST
7.39 5.67 vaww02